
Amazon stock under pressure as MACD points to weakening buyer interest: weekly review

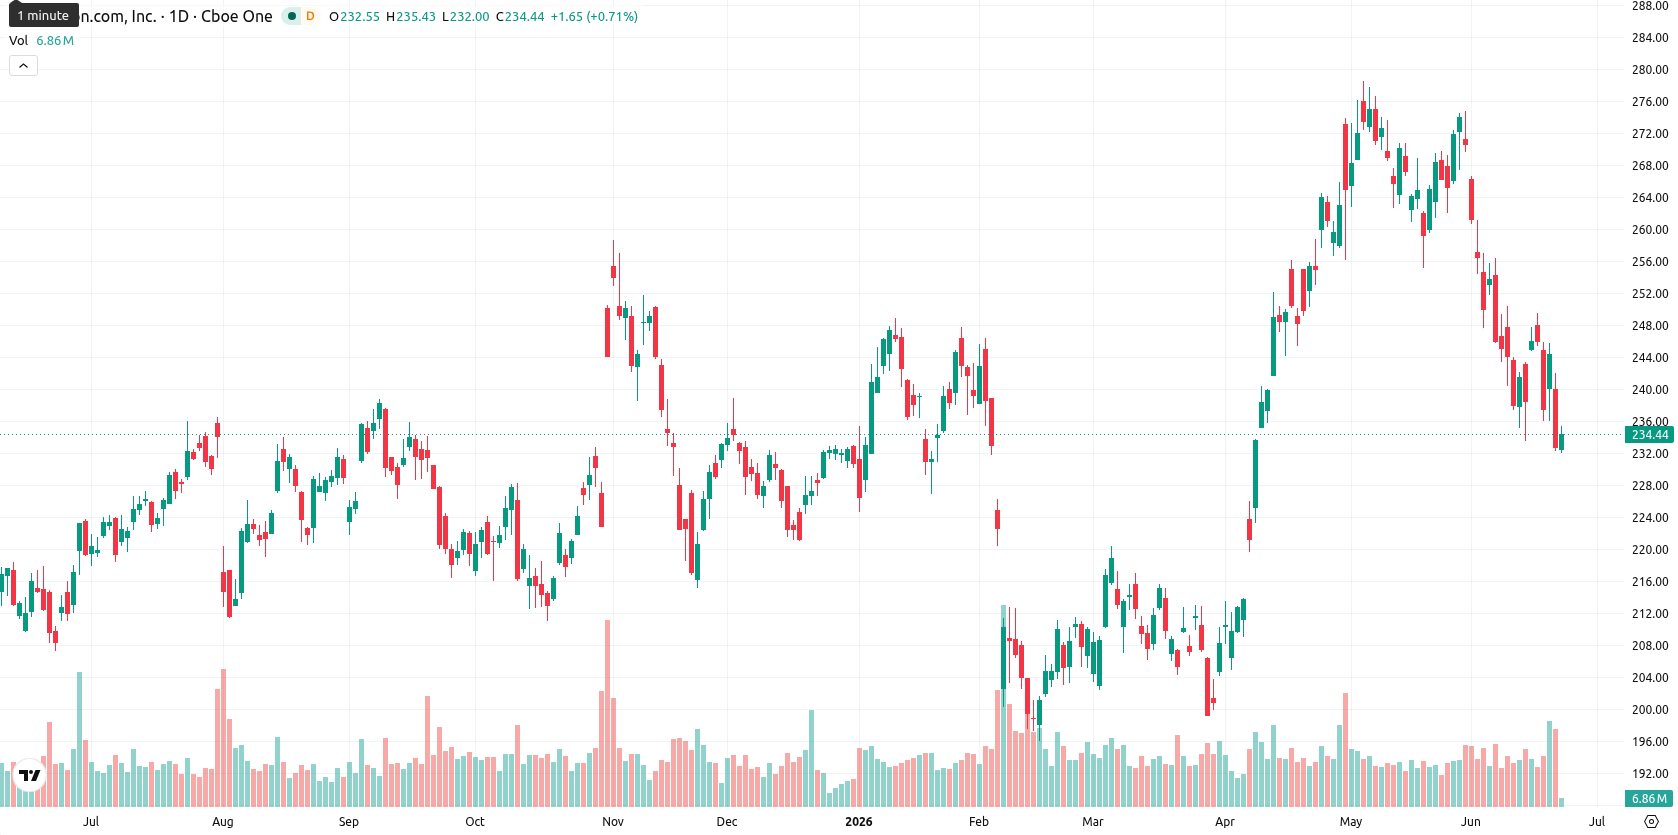
Amazon.com, Inc. (AMZN) is currently trading at $233.40, marking a drop of $10.68 (4.38%) over the past week. The price ended the week just below the MA-20 ($235.42), slightly above the MA-50 ($231.43), and well above the MA-200 ($176.20), signaling medium-term selling pressure but a broadly intact longer-term bullish structure, with the MA-50 serving as dynamic support.
Highlights
- Amazon remains above long-term support, but medium-term selling pressure dominates as recent declines persist.
- Momentum indicators are mostly neutral to bearish, suggesting weak trend conviction and limited upside potential near term.
- AMZN is likely to trade between $225 and $243 in the next week, with further downside risk if $231 support fails.
Robust earnings and AWS growth offset by capex and profit worries
Amazon reported strong Q1 2026 results with earnings per share of $2.78, surpassing expectations and showing a 74.8% year-over-year increase. The AWS cloud segment recorded its fastest growth in 15 quarters at 28%, while Amazon's announced $200 billion capital expenditure plan for 2026 has raised investor concerns regarding future profitability and cash flow. The company has also scheduled its 2026 Prime Day event for June 23 through June 26, with projections for a 9% increase in spending to $26.3 billion.
Consolidation and declining momentum as price holds near support
On the weekly chart, AMZN remains sandwiched between the MA-20 ($235.42) and the MA-50 ($231.43), highlighting a narrow consolidation area amid declining momentum. Volatility remains elevated at 7.42%, and the price sits at the bottom of its weekly range, with the MA-50 offering crucial near-term support. The weekly RSI and other oscillators suggest neutral to oversold conditions, while the MACD indicates persistent, but weakening, buyer interest and the ADX at 12.95 signals a lack of clear trend direction. Key resistance levels are identified at $235 and $243, with support clustered at $231 and $225.
Range-bound outlook as weak momentum limits upside for next week
Looking ahead to the next 5 trading days, AMZN is expected to oscillate between $225 and $243, reflecting a continued range-bound environment shaped by weak and divergent momentum signals on the weekly timeframe. The baseline scenario anticipates sideways movement near current levels, while a bullish scenario requires a close above $243 to trigger a short-term rebound. Conversely, a break below $231 could invite further selling pressure, extending the ongoing correction toward weekly support at $225. Upside probability is limited, with only one out of four main weekly momentum indicators providing a buy signal.
Earlier, analysts noted that Amazon was navigating mixed short- and medium-term technical signals while longer-term support for the shares remained intact. With recent earnings strength offset by persistent investor caution and a tightening consolidation range, traders should watch for a decisive break above $243 or below $231 to signal the next directional move.


-
 Afghanistan
-
 Albania
-
 Algeria
-
 Angola
-
 Argentina
-
 Armenia
-
 Australia
-
 Austria
-
 Azerbaijan
-
 Bahamas
-
 Bahrain
-
 Bangladesh
-
 Belarus
-
 Belgium
-
 Bolivia
-
 Botswana
-
 Brazil
-
 Brunei
-
 Bulgaria
-
 Cambodia
-
 Cameroon
-
 Canada
-
 Chile
Chile
-
 China
China
-
 Colombia
-
 Congo
Congo
-
 Costa Rica
-
 Cote d'Ivoire
-
 Croatia
-
 Cuba
Cuba
-
 Cyprus
-
 Czechia
-
 DR Congo
-
 Denmark
-
 Dominican Republic
-
 Ecuador
-
 Egypt
Egypt
-
 El Salvador
-
 Estonia
-
 Eswatini
-
 Ethiopia
-
 Finland
-
 France
-
 Georgia
-
 Germany
-
 Ghana
Ghana
-
 Greece
-
 Haiti
Haiti
-
 Hong Kong
-
 Hungary
-
 India
India
-
 Indonesia
-
 Iran, Islamic republic
-
 Iraq
Iraq
-
 Ireland
-
 Israel
-
 Italy
Italy
-
 Jamaica
-
 Japan
Japan
-
 Jordan
-
 Kazakhstan
-
 Kenya
Kenya
-
 Korea
Korea
-
 Kuwait
-
 Kyrgyzstan
-
 Laos
Laos
-
 Latvia
-
 Lebanon
-
 Lesotho
-
 Libya
Libya
-
 Lithuania
-
 Luxembourg
-
 Madagascar
-
 Malaysia
-
 Malta
Malta
-
 Mauritius
-
 Mexico
-
 Moldova
-
 Mongolia
-
 Montenegro
-
 Morocco
-
 Mozambique
-
 Myanmar
-
 Namibia
-
 Nepal
Nepal
-
 Netherlands
-
 New Zealand
-
 Nigeria
-
 North Macedonia
-
 Norway
-
 Oman
Oman
-
 Pakistan
-
 Palestine
-
 Panama
-
 Papua New Guinea
-
 Paraguay
-
 Peru
Peru
-
 Philippines
-
 Poland
-
 Portugal
-
 Puerto Rico
-
 Qatar
Qatar
-
 Reunion
-
 Romania
-
 Rwanda
-
 Saudi Arabia
-
 Serbia
-
 Singapore
-
 Slovakia
-
 Slovenia
-
 Somalia
-
 South Africa
-
 Spain
Spain
-
 Sri Lanka
-
 Sweden
-
 Switzerland
-
 Syria
Syria
-
 Taiwan
-
 Tajikistan
-
 Tanzania
-
 Thailand
-
 Trinidad and Tobago
-
 Tunisia
-
 Turkey
-
 UAE
UAE
-
 Uganda
-
 Ukraine
-
 United Kingdom
-
United States
-
 Uruguay
-
 Uzbekistan
-
 Venezuela
-
 Vietnam
-
 Yemen
Yemen
-
 Zambia
-
 Zimbabwe
- Forex
- Crypto
