
Bit Digital stock edges lower as price remains well below long-term average

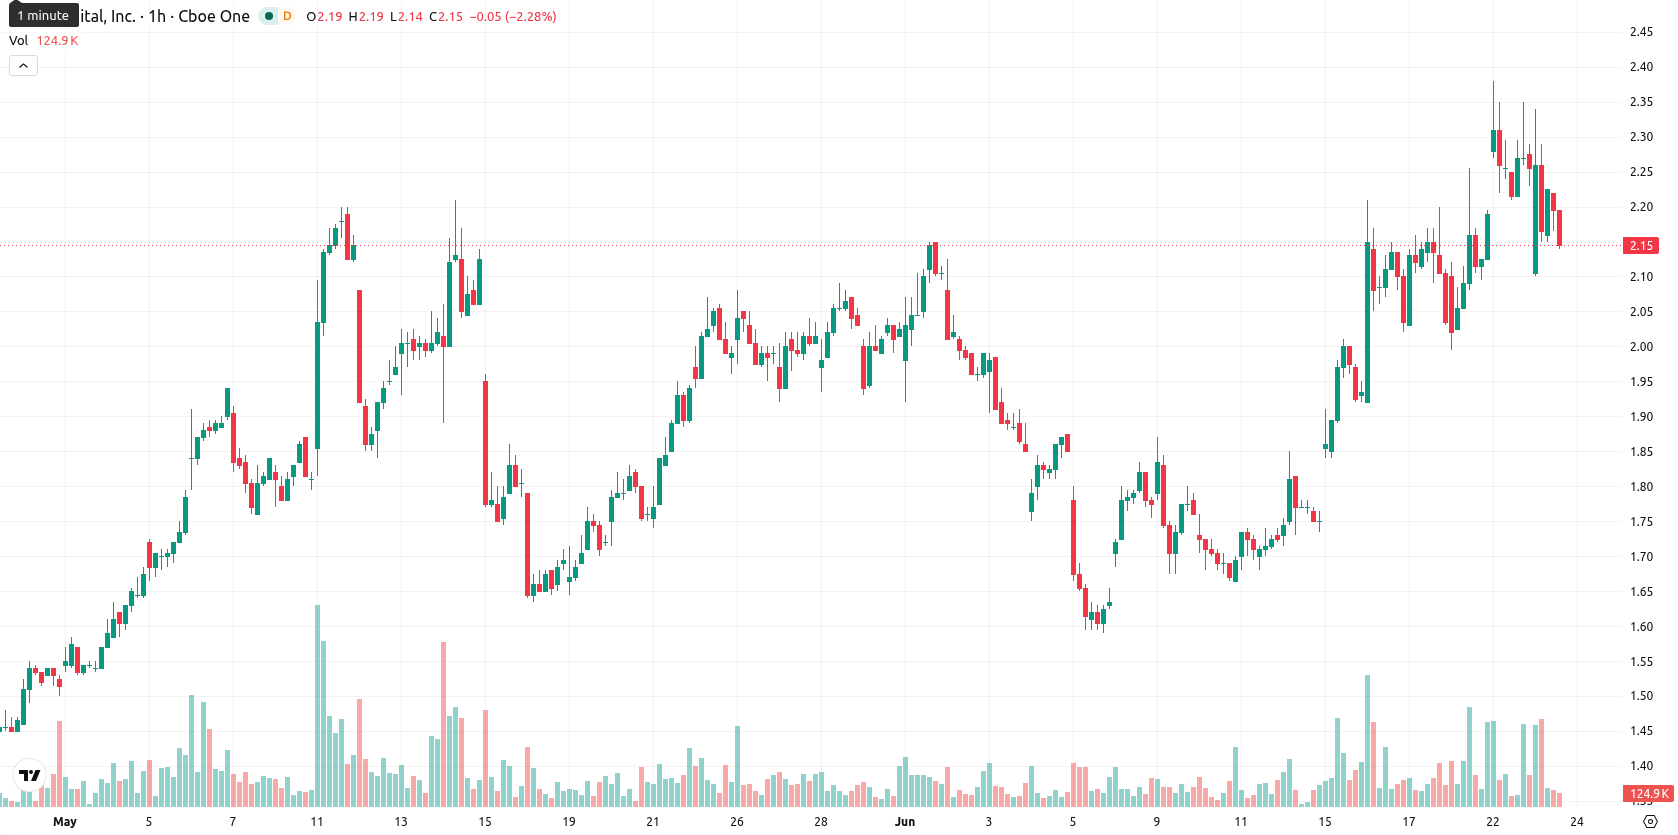
Bit Digital Inc. (BTBT) stock is trading at $2.17 after falling 2.69% during the session. The price currently sits above its key short- and medium-term moving averages, with daily price action marked by significant volatility.
Highlights
- BTBT/USD is experiencing conflicting momentum signals, with short- and medium-term buyers active amid persistent long-term bearish pressure.
- Intraday selling has dominated, as price slipped 2.69% to $2.17 and closed near the session low with heightened volatility.
- Expected range over the next 2–3 sessions is $2 to $2.34, with moderate probability for a rebound if price exceeds $2.19 resistance.
Mixed momentum signals amid resistance at Kijun level
On the technical side, BTBT/USD has closed above the MA-20 and MA-50, while staying below the MA-200, reflecting buyer interest on the short and medium timeframes with longer-term bearish overhang. The Ichimoku Kijun level at $2.19 acts as immediate resistance. MACD indicates a strong buy signal and the ADX confirms ongoing buyer strength, while the RSI holds at 52.69 and the Stoch RSI is oversold, suggesting the potential for a short-term rebound. CCI and AO both register neutral readings, but BBP is signaling a sell, pointing to heightened intraday seller activity and measurable divergence among momentum signals.
Rangebound trade likely as volatility shapes directional risk
Over the upcoming 2–3 sessions, the most likely scenario is price consolidation within the $2 to $2.34 band, reflecting the current volatility. There is a moderate probability (63%) that the price will move higher, while a decline is possible but less likely (37%). A bullish scenario would require BTBT to close above the immediate $2.19 resistance level, while a drop below $2 support would open the way for further downside.
Earlier, analysts noted that Bit Digital was demonstrating robust short- and medium-term momentum, tempered by notable longer-term resistance and heightened volatility. The current analysis reinforces this view while highlighting that a confirmed close above immediate resistance could signal renewed bullish momentum, making $2.19 the key level to watch for a potential breakout.


Latest Bit Digital News


-
 Afghanistan
-
 Albania
-
 Algeria
-
 Angola
-
 Argentina
-
 Armenia
-
 Australia
-
 Austria
-
 Azerbaijan
-
 Bahamas
-
 Bahrain
-
 Bangladesh
-
 Belarus
-
 Belgium
-
 Bolivia
-
 Botswana
-
 Brazil
-
 Brunei
-
 Bulgaria
-
 Cambodia
-
 Cameroon
-
 Canada
-
 Chile
Chile
-
 China
China
-
 Colombia
-
 Congo
Congo
-
 Costa Rica
-
 Cote d'Ivoire
-
 Croatia
-
 Cuba
Cuba
-
 Cyprus
-
 Czechia
-
 DR Congo
-
 Denmark
-
 Dominican Republic
-
 Ecuador
-
 Egypt
Egypt
-
 El Salvador
-
 Estonia
-
 Eswatini
-
 Ethiopia
-
 Finland
-
 France
-
 Georgia
-
 Germany
-
 Ghana
Ghana
-
 Greece
-
 Haiti
Haiti
-
 Hong Kong
-
 Hungary
-
 India
India
-
 Indonesia
-
 Iran, Islamic republic
-
 Iraq
Iraq
-
 Ireland
-
 Israel
-
 Italy
Italy
-
 Jamaica
-
 Japan
Japan
-
 Jordan
-
 Kazakhstan
-
 Kenya
Kenya
-
 Korea
Korea
-
 Kuwait
-
 Kyrgyzstan
-
 Laos
Laos
-
 Latvia
-
 Lebanon
-
 Lesotho
-
 Libya
Libya
-
 Lithuania
-
 Luxembourg
-
 Madagascar
-
 Malaysia
-
 Malta
Malta
-
 Mauritius
-
 Mexico
-
 Moldova
-
 Mongolia
-
 Montenegro
-
 Morocco
-
 Mozambique
-
 Myanmar
-
 Namibia
-
 Nepal
Nepal
-
 Netherlands
-
 New Zealand
-
 Nigeria
-
 North Macedonia
-
 Norway
-
 Oman
Oman
-
 Pakistan
-
 Palestine
-
 Panama
-
 Papua New Guinea
-
 Paraguay
-
 Peru
Peru
-
 Philippines
-
 Poland
-
 Portugal
-
 Puerto Rico
-
 Qatar
Qatar
-
 Reunion
-
 Romania
-
 Rwanda
-
 Saudi Arabia
-
 Serbia
-
 Singapore
-
 Slovakia
-
 Slovenia
-
 Somalia
-
 South Africa
-
 Spain
Spain
-
 Sri Lanka
-
 Sweden
-
 Switzerland
-
 Syria
Syria
-
 Taiwan
-
 Tajikistan
-
 Tanzania
-
 Thailand
-
 Trinidad and Tobago
-
 Tunisia
-
 Turkey
-
 UAE
UAE
-
 Uganda
-
 Ukraine
-
 United Kingdom
-
United States
-
 Uruguay
-
 Uzbekistan
-
 Venezuela
-
 Vietnam
-
 Yemen
Yemen
-
 Zambia
-
 Zimbabwe
- Forex
- Crypto
