
Meta Platforms stock price forecast: Approaching $540.88 support as META declines 1.40% to $549.83

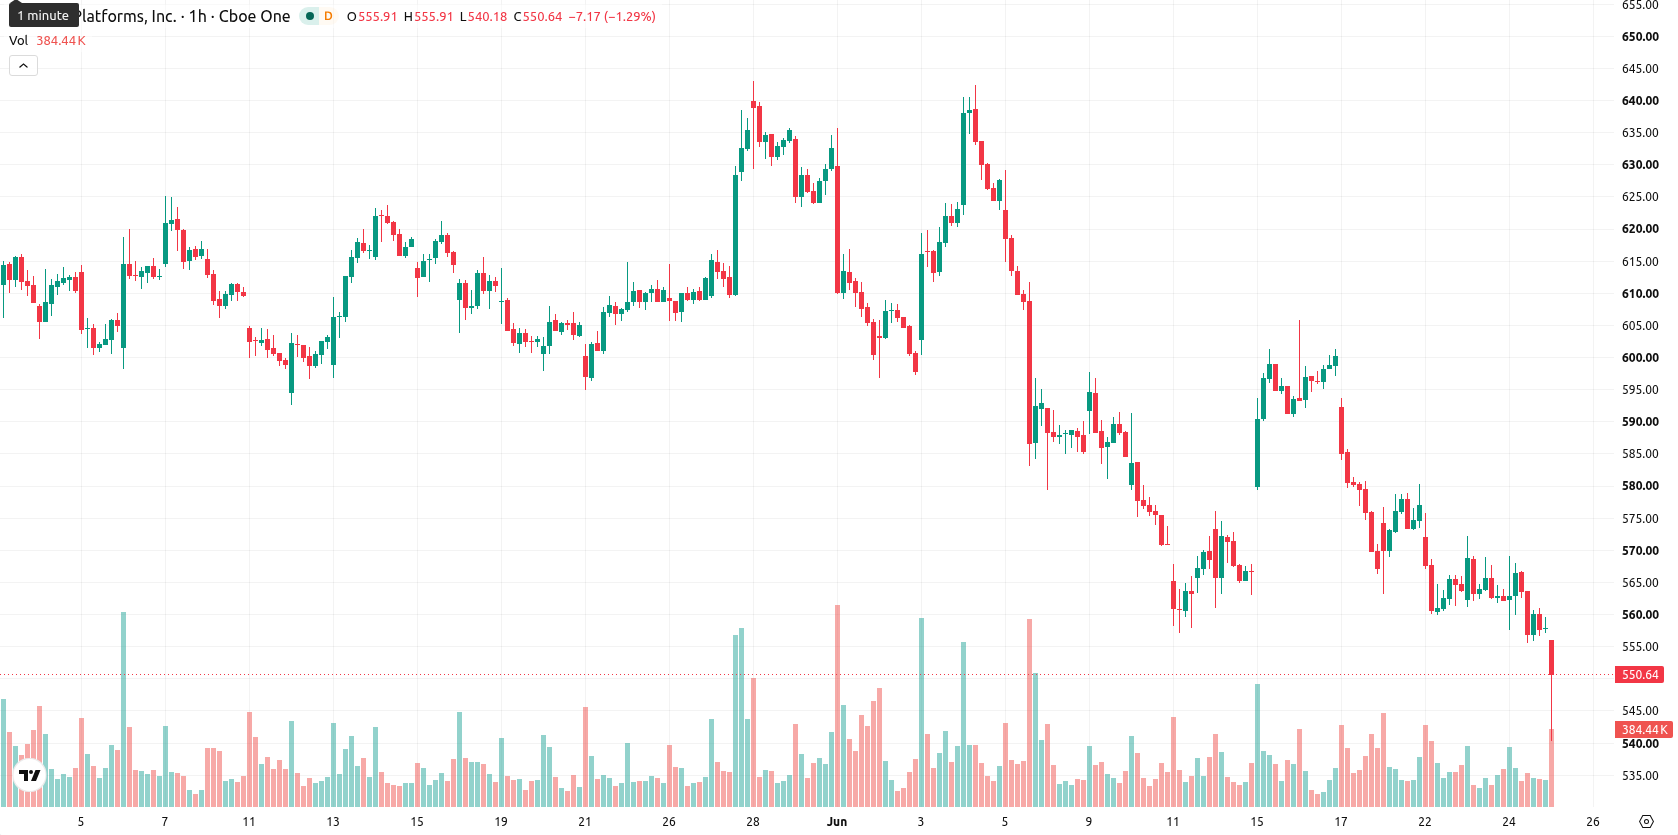
Meta Platforms (META) stock is trading at $549.83, marking a daily decline of 1.4%. The price sits below its key moving averages, reflecting continued short-term pressure.
Highlights
- Meta Platforms experiences sustained selling pressure, trading beneath its short-, medium-, and long-term moving averages across all timeframes.
- Technical momentum and oscillator indicators collectively confirm a strongly bearish trend, with little evidence of potential reversal.
- Expected price range for Meta over the next sessions is $540.88 to $560.36, with low probability of upward movement.
Momentum weakness confirmed as technicals show seller control
On the technical front, META trades below its 20-, 50-, and 200-period moving averages on the hourly chart, indicating seller dominance across all timeframes. The Ichimoku Kijun level at $560.28 serves as immediate resistance. Both the Moving Average Convergence Divergence (MACD) and Awesome Oscillator confirm ongoing bearish momentum, while the Average Directional Index (ADX) signals a neutral trend strength. Oversold readings from the Relative Strength Index (RSI), Stochastic RSI, Commodity Channel Index (CCI), and a negative Bull/Bear Power further identify strong seller activity intraday. There is alignment across momentum and oscillator readings, with no divergence observed.
Bearish bias prevails as range tests downside support
In the short term, META is expected to trade within a corridor of $540.88 to $560.36, with probabilities skewed heavily toward further downside. While gains are unlikely amid the current setup, a bullish move would require a clear break above the Ichimoku Kijun resistance at $560.28. Conversely, a bearish scenario would unfold if the price breaks below support near $540.88, extending the prevailing downward tone.
Earlier, analysts noted that Meta’s profitability faced growing cost pressures amid rising component prices, especially for memory driven by persistent AI demand. Today’s technical setup underscores how these sector-wide margin constraints are coinciding with distinct, short-term selling pressure in Meta shares, suggesting that sustained recovery will likely depend on a decisive shift above resistance at $560.28.


-
 Afghanistan
-
 Albania
-
 Algeria
-
 Angola
-
 Argentina
-
 Armenia
-
 Australia
-
 Austria
-
 Azerbaijan
-
 Bahamas
-
 Bahrain
-
 Bangladesh
-
 Belarus
-
 Belgium
-
 Bolivia
-
 Botswana
-
 Brazil
-
 Brunei
-
 Bulgaria
-
 Cambodia
-
 Cameroon
-
 Canada
-
 Chile
Chile
-
 China
China
-
 Colombia
-
 Congo
Congo
-
 Costa Rica
-
 Cote d'Ivoire
-
 Croatia
-
 Cuba
Cuba
-
 Cyprus
-
 Czechia
-
 DR Congo
-
 Denmark
-
 Dominican Republic
-
 Ecuador
-
 Egypt
Egypt
-
 El Salvador
-
 Estonia
-
 Eswatini
-
 Ethiopia
-
 Finland
-
 France
-
 Georgia
-
 Germany
-
 Ghana
Ghana
-
 Greece
-
 Haiti
Haiti
-
 Hong Kong
-
 Hungary
-
 India
India
-
 Indonesia
-
 Iran, Islamic republic
-
 Iraq
Iraq
-
 Ireland
-
 Israel
-
 Italy
Italy
-
 Jamaica
-
 Japan
Japan
-
 Jordan
-
 Kazakhstan
-
 Kenya
Kenya
-
 Korea
Korea
-
 Kuwait
-
 Kyrgyzstan
-
 Laos
Laos
-
 Latvia
-
 Lebanon
-
 Lesotho
-
 Libya
Libya
-
 Lithuania
-
 Luxembourg
-
 Madagascar
-
 Malaysia
-
 Malta
Malta
-
 Mauritius
-
 Mexico
-
 Moldova
-
 Mongolia
-
 Montenegro
-
 Morocco
-
 Mozambique
-
 Myanmar
-
 Namibia
-
 Nepal
Nepal
-
 Netherlands
-
 New Zealand
-
 Nigeria
-
 North Macedonia
-
 Norway
-
 Oman
Oman
-
 Pakistan
-
 Palestine
-
 Panama
-
 Papua New Guinea
-
 Paraguay
-
 Peru
Peru
-
 Philippines
-
 Poland
-
 Portugal
-
 Puerto Rico
-
 Qatar
Qatar
-
 Reunion
-
 Romania
-
 Rwanda
-
 Saudi Arabia
-
 Serbia
-
 Singapore
-
 Slovakia
-
 Slovenia
-
 Somalia
-
 South Africa
-
 Spain
Spain
-
 Sri Lanka
-
 Sweden
-
 Switzerland
-
 Syria
Syria
-
 Taiwan
-
 Tajikistan
-
 Tanzania
-
 Thailand
-
 Trinidad and Tobago
-
 Tunisia
-
 Turkey
-
 UAE
UAE
-
 Uganda
-
 Ukraine
-
 United Kingdom
-
United States
-
 Uruguay
-
 Uzbekistan
-
 Venezuela
-
 Vietnam
-
 Yemen
Yemen
-
 Zambia
-
 Zimbabwe
- Forex
- Crypto
