

Limited downside risk caps Skyworks Solutions stock slide

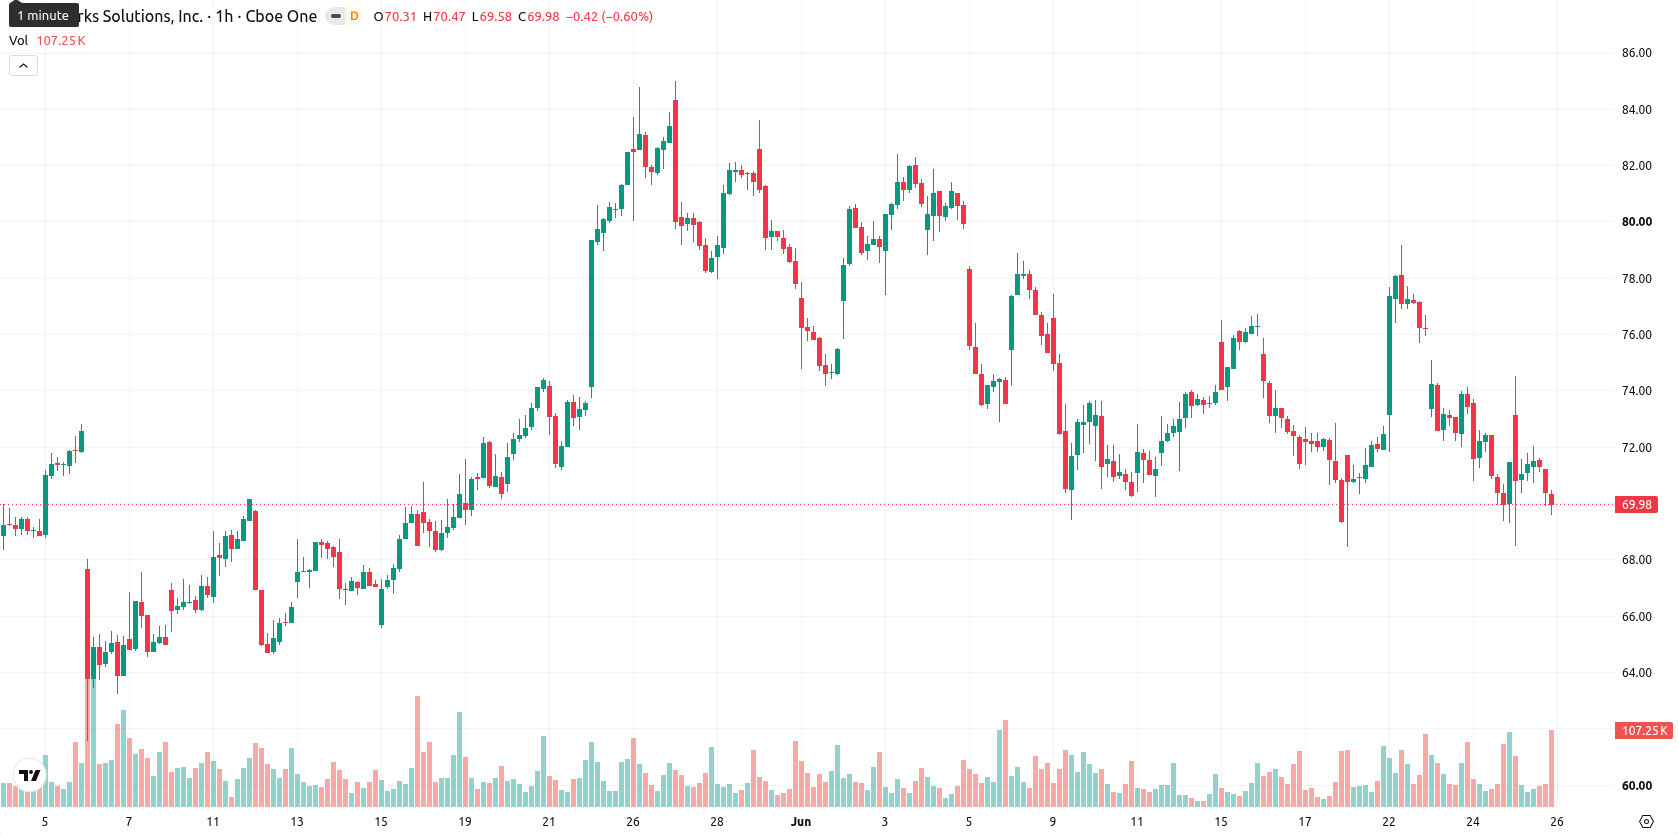
Skyworks Solutions (SWKS) stock is trading at $69.94, down 2.04% on the day. The price is currently positioned below its key short- and medium-term moving averages but remains supported by longer-term averages.
 90.66
93.09
Highlights
- SWKS faces persistent selling as price trades below short- and mid-term moving averages but stays above long-term support.
- Bearish momentum signals dominate intraday action, with oscillators indicating oversold conditions and weak buying strength.
- Next 2–3 days project highly probable downside toward $65.52, with resistance at $73.82 and elevated volatility expected.
Oversold signals deepen as sellers dominate below resistance
On the hourly chart, SWKS is trading below its 20-period and 50-period moving averages, set at $71.72 and $72.7, respectively, while holding above the 200-period moving average at $66.39. Immediate resistance is indicated by the Ichimoku Kijun level at $73.82. The Relative Strength Index (RSI) stands at 38.17, suggesting a sell bias, and both the Commodity Channel Index (CCI) and Bull/Bear Power (BBP) are in oversold territory, pointing to intraday dominance by sellers. The Moving Average Convergence Divergence (MACD) has issued a Sell signal, while the Average Directional Index (ADX) indicates neutral trend strength. The Stochastic RSI is neutral, showing some divergence with other oscillators, and the Awesome Oscillator also signals selling pressure.
Downside seen likely given momentum and volatility range
Over the next two to three trading days, SWKS is likely to consolidate within a volatility band between $65.52 and $74.36. The probability of a move higher is considered very low, while further declines are very highly probable based on momentum and indicator readings. A potential recovery would be signaled by a break above $73.82, while a drop below $65.52 would expose further downside risk.






Latest Skyworks Solutions News





-
 Afghanistan
-
 Albania
-
 Algeria
-
 Angola
-
 Argentina
-
 Armenia
-
 Australia
-
 Austria
-
 Azerbaijan
-
 Bahamas
-
 Bahrain
-
 Bangladesh
-
 Belarus
-
 Belgium
-
 Bolivia
-
 Botswana
-
 Brazil
-
 Brunei
-
 Bulgaria
-
 Cambodia
-
 Cameroon
-
 Canada
-
 Chile
-
 China
-
 Colombia
-
 Congo
-
 Costa Rica
-
 Cote d'Ivoire
-
 Croatia
-
 Cuba
-
 Cyprus
-
 Czechia
-
 DR Congo
-
 Denmark
-
 Dominican Republic
-
 Ecuador
-
 Egypt
-
 El Salvador
-
 Estonia
-
 Eswatini
-
 Ethiopia
-
 Finland
-
 France
-
 Georgia
-
 Germany
-
 Ghana
-
 Greece
-
 Haiti
-
 Hong Kong
-
 Hungary
-
 India
-
 Indonesia
-
 Iran, Islamic republic
-
 Iraq
-
 Ireland
-
 Israel
-
 Italy
-
 Jamaica
-
 Japan
-
 Jordan
-
 Kazakhstan
-
 Kenya
-
 Korea
-
 Kuwait
-
 Kyrgyzstan
-
 Laos
-
 Latvia
-
 Lebanon
-
 Lesotho
-
 Libya
-
 Lithuania
-
 Luxembourg
-
 Madagascar
-
 Malaysia
-
 Malta
-
 Mauritius
-
 Mexico
-
 Moldova
-
 Mongolia
-
 Montenegro
-
 Morocco
-
 Mozambique
-
 Myanmar
-
 Namibia
-
 Nepal
-
 Netherlands
-
 New Zealand
-
 Nigeria
-
 North Macedonia
-
 Norway
-
 Oman
-
 Pakistan
-
 Palestine
-
 Panama
-
 Papua New Guinea
-
 Paraguay
-
 Peru
-
 Philippines
-
 Poland
-
 Portugal
-
 Puerto Rico
-
 Qatar
-
 Reunion
-
 Romania
-
 Rwanda
-
 Saudi Arabia
-
 Serbia
-
 Singapore
-
 Slovakia
-
 Slovenia
-
 Somalia
-
 South Africa
-
 Spain
-
 Sri Lanka
-
 Sweden
-
 Switzerland
-
 Syria
-
 Taiwan
-
 Tajikistan
-
 Tanzania
-
 Thailand
-
 Trinidad and Tobago
-
 Tunisia
-
 Turkey
-
 UAE
-
 Uganda
-
 Ukraine
-
 United Kingdom
-
United States
-
 Uruguay
-
 Uzbekistan
-
 Venezuela
-
 Vietnam
-
 Yemen
-
 Zambia
-
 Zimbabwe
- Forex
- Crypto












