
-9.55% for Bit Digital stock as selling momentum tests $1.56–$2.04 range

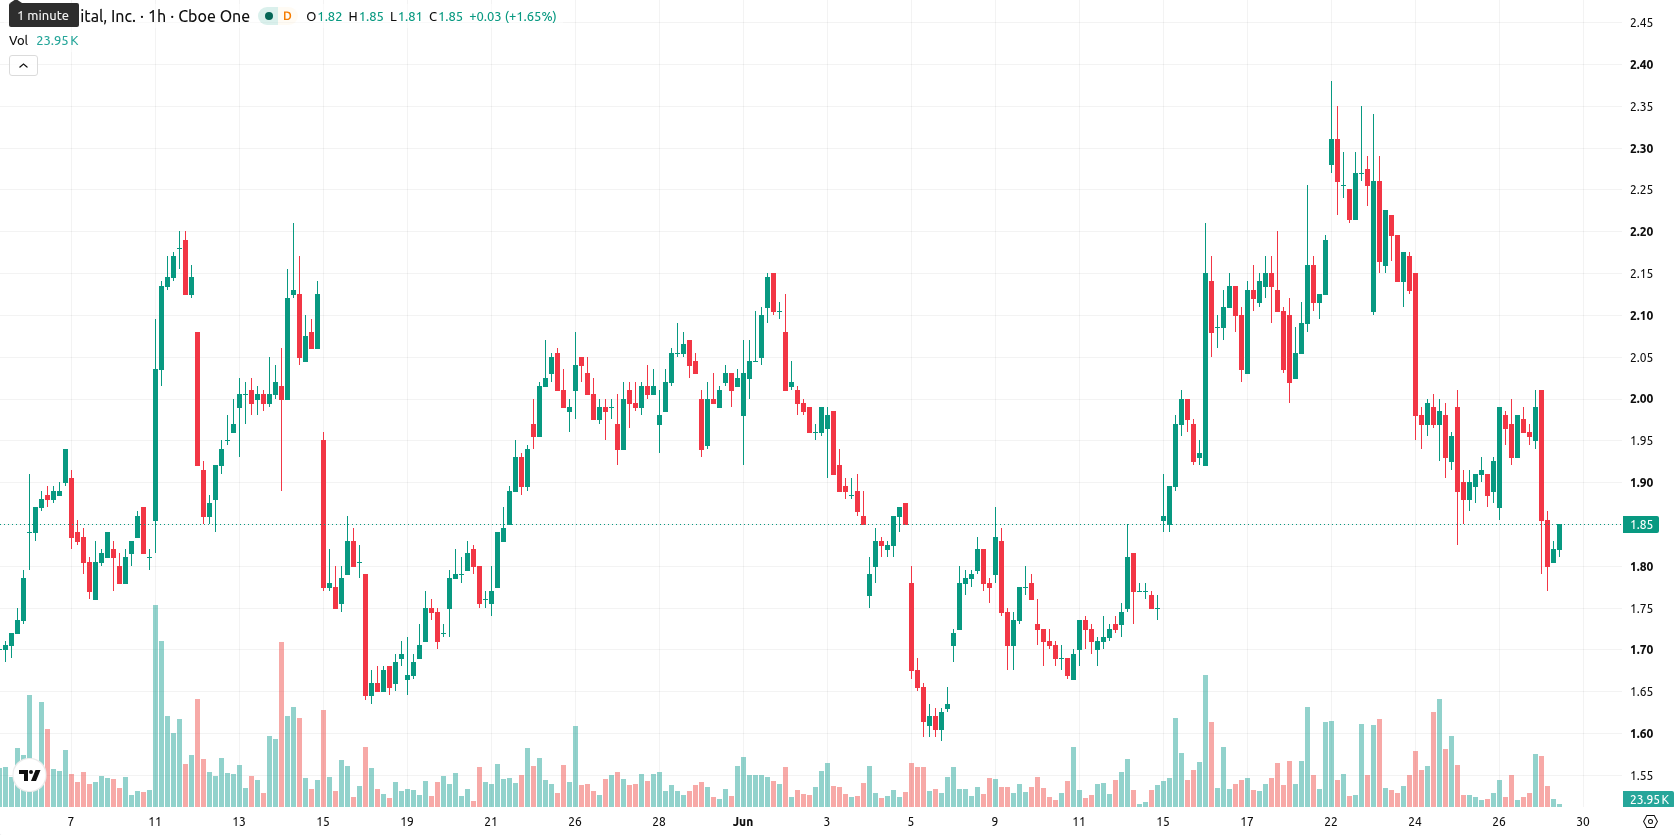
Bit Digital (BTBT) stock is trading at $1.8, down 9.55% on the day, with shares firmly below their short- and long-term moving averages.
Highlights
- BTBT/USD faces persistent selling pressure as it trades beneath key moving averages across all timeframes.
- Bearish momentum remains dominant, while oversold oscillators reflect only limited potential for an upward retracement.
- The expected price range is $1.56 to $2.04, with a high probability of a further decline if $1.56 support breaks.
Technical barriers hold as intraday bearish momentum accelerates
On the hourly chart, BTBT sits below the MA-20 at $1.93, MA-50 at $2.06, and MA-200 at $2.24, which highlights the distance from key technical resistance points. The Ichimoku Kijun line is positioned at $2, marking immediate overhead resistance. Among momentum indicators, the Moving Average Convergence Divergence (MACD) and the Average Directional Index (ADX) both point to persistent bearish momentum. Meanwhile, the Relative Strength Index (RSI) stands at 39.18, the Stochastic RSI, and the Commodity Channel Index (CCI) all reflect oversold conditions, and Bull/Bear Power suggests sellers control the intraday action. The Awesome Oscillator, however, remains neutral and does not confirm the current trend.
Further downside risk as range-bound action faces key pivot
Over the short term, the expected price range for BTBT is $1.56 to $2.04, consistent with recent volatility. The scenario analysis suggests a low probability for an upward move, with high likelihood for further declines unless the $2 resistance is overcome. If BTBT consolidates within this range, the baseline scenario is sideways movement; breaching $2 could prompt short covering, while a drop below $1.56 would open the way to new lows.
Earlier, analysts noted that Bit Digital was at a technical inflection point, with balanced risks for both upward and downward moves as volatility persisted. The current setup, marked by deepening bearish momentum and firmly oversold signals, now elevates downside risk, making a break below $1.56 a crucial level for traders to monitor.


Latest Bit Digital News


-
 Afghanistan
-
 Albania
-
 Algeria
-
 Angola
-
 Argentina
-
 Armenia
-
 Australia
-
 Austria
-
 Azerbaijan
-
 Bahamas
-
 Bahrain
-
 Bangladesh
-
 Belarus
-
 Belgium
-
 Bolivia
-
 Botswana
-
 Brazil
-
 Brunei
-
 Bulgaria
-
 Cambodia
-
 Cameroon
-
 Canada
-
 Chile
Chile
-
 China
China
-
 Colombia
-
 Congo
Congo
-
 Costa Rica
-
 Cote d'Ivoire
-
 Croatia
-
 Cuba
Cuba
-
 Cyprus
-
 Czechia
-
 DR Congo
-
 Denmark
-
 Dominican Republic
-
 Ecuador
-
 Egypt
Egypt
-
 El Salvador
-
 Estonia
-
 Eswatini
-
 Ethiopia
-
 Finland
-
 France
-
 Georgia
-
 Germany
-
 Ghana
Ghana
-
 Greece
-
 Haiti
Haiti
-
 Hong Kong
-
 Hungary
-
 India
India
-
 Indonesia
-
 Iran, Islamic republic
-
 Iraq
Iraq
-
 Ireland
-
 Israel
-
 Italy
Italy
-
 Jamaica
-
 Japan
Japan
-
 Jordan
-
 Kazakhstan
-
 Kenya
Kenya
-
 Korea
Korea
-
 Kuwait
-
 Kyrgyzstan
-
 Laos
Laos
-
 Latvia
-
 Lebanon
-
 Lesotho
-
 Libya
Libya
-
 Lithuania
-
 Luxembourg
-
 Madagascar
-
 Malaysia
-
 Malta
Malta
-
 Mauritius
-
 Mexico
-
 Moldova
-
 Mongolia
-
 Montenegro
-
 Morocco
-
 Mozambique
-
 Myanmar
-
 Namibia
-
 Nepal
Nepal
-
 Netherlands
-
 New Zealand
-
 Nigeria
-
 North Macedonia
-
 Norway
-
 Oman
Oman
-
 Pakistan
-
 Palestine
-
 Panama
-
 Papua New Guinea
-
 Paraguay
-
 Peru
Peru
-
 Philippines
-
 Poland
-
 Portugal
-
 Puerto Rico
-
 Qatar
Qatar
-
 Reunion
-
 Romania
-
 Rwanda
-
 Saudi Arabia
-
 Serbia
-
 Singapore
-
 Slovakia
-
 Slovenia
-
 Somalia
-
 South Africa
-
 Spain
Spain
-
 Sri Lanka
-
 Sweden
-
 Switzerland
-
 Syria
Syria
-
 Taiwan
-
 Tajikistan
-
 Tanzania
-
 Thailand
-
 Trinidad and Tobago
-
 Tunisia
-
 Turkey
-
 UAE
UAE
-
 Uganda
-
 Ukraine
-
 United Kingdom
-
United States
-
 Uruguay
-
 Uzbekistan
-
 Venezuela
-
 Vietnam
-
 Yemen
Yemen
-
 Zambia
-
 Zimbabwe
- Forex
- Crypto
