

Trimble (TRMB) stock is trading at $50.77, posting a slight gain for the day. The price sits above its short- and medium-term moving averages while remaining below long-term trend levels.
Highlights
- TRMB/USD shows short- and medium-term bullish structure, but long-term trend remains pressured by sellers.
- Mixed momentum and oscillator signals indicate uncertainty, with intraday upward bias requiring caution due to trend conflict.
- Expected 2–3 day price range is $49.70–$51.84; 62% probability favors upside, with key support near $50.38 and risk if breached.
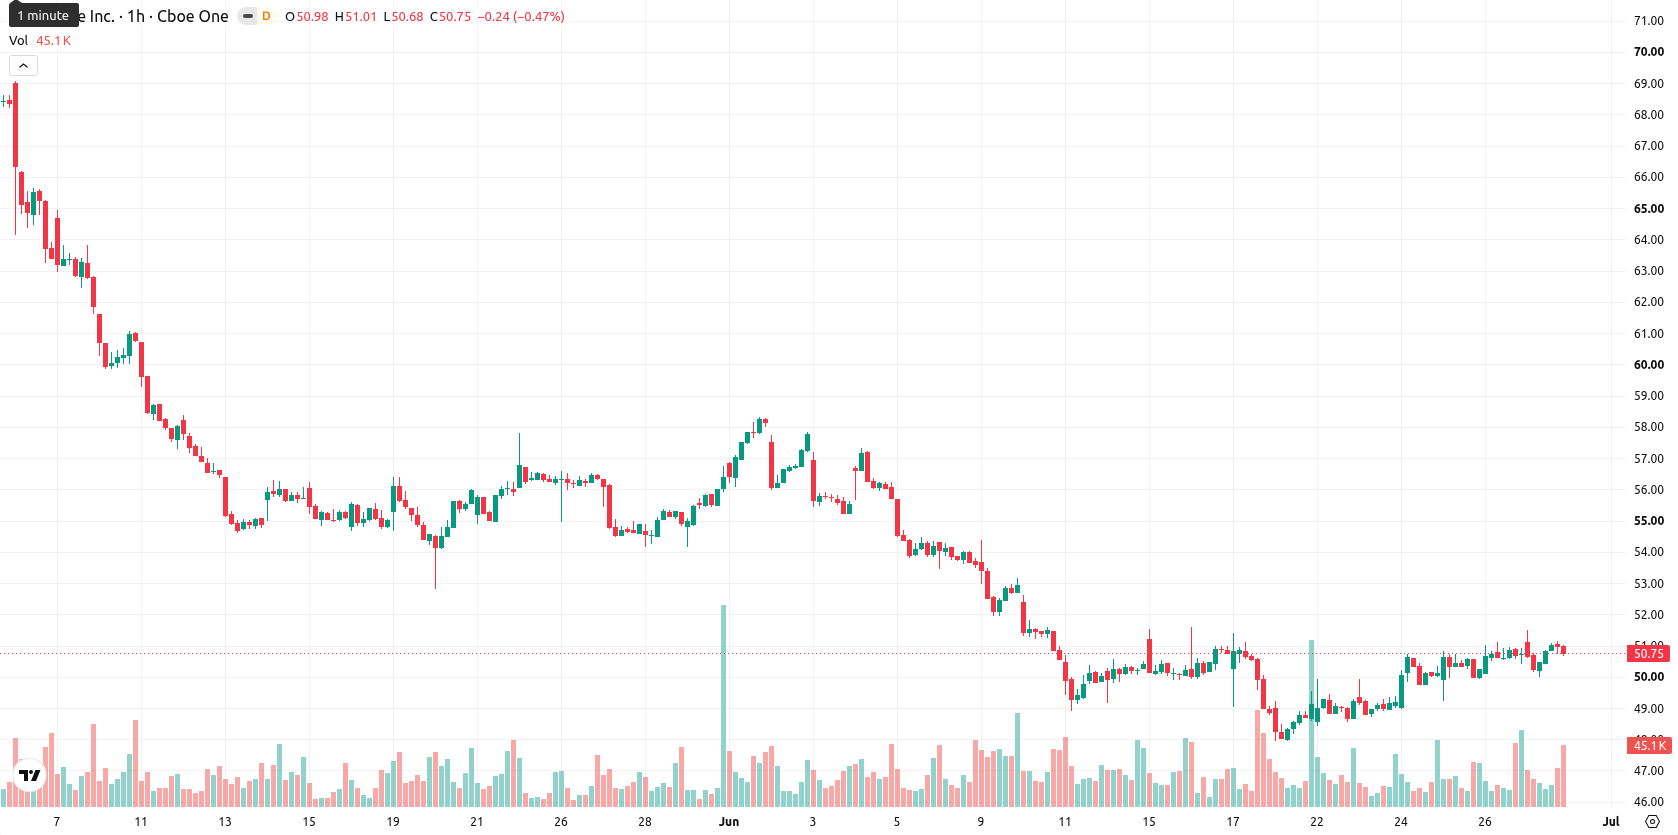
Divergent momentum signals as price holds above intraday support
TRMB is trading above its 20-period and 50-period moving averages on the hourly chart, confirming short- and medium-term momentum, but remains well below the 200-period moving average, which points to persisting long-term resistance. The Ichimoku Kijun is at $50.38 and acts as immediate intraday support. Among momentum signals, the Moving Average Convergence Divergence (MACD) gives a strong buy, while the Average Directional Index (ADX) remains neutral, indicating moderate trend strength. The Relative Strength Index (RSI) stands at 56.04 (Buy), the Stochastic RSI signals a strong sell, and the Commodity Channel Index (CCI) registers a buy, resulting in significant divergence among oscillators. Bull/Bear Power signals strong buyer dominance intraday, while the Awesome Oscillator is neutral, reflecting a mixed technical landscape.
Sideways outlook as breakout risk shapes next move
Over the next two to three trading days, TRMB is expected to fluctuate within a range of $49.7 to $51.84, a typical volatility band relative to current levels. The probability of an upside move is moderately higher at 62%, with a less likely scenario of a downward correction. The baseline outlook anticipates sideways price action; however, a clear breakout above resistance could target the upper end of the range, while a breach of support near the Ichimoku Kijun would open scope for downside.
Earlier, analysts noted that Trimble was pressured by persistent bearish momentum and struggled to overcome long-term resistance. The current mixed technical readings suggest a potential shift from previous weakness, making the upper boundary of the $51.84 range a key level to monitor for any breakout in the coming days.


Latest Trimble News


-
 Afghanistan
-
 Albania
-
 Algeria
-
 Angola
-
 Argentina
-
 Armenia
-
 Australia
-
 Austria
-
 Azerbaijan
-
 Bahamas
-
 Bahrain
-
 Bangladesh
-
 Belarus
-
 Belgium
-
 Bolivia
-
 Botswana
-
 Brazil
-
 Brunei
-
 Bulgaria
-
 Cambodia
-
 Cameroon
-
 Canada
-
 Chile
Chile
-
 China
China
-
 Colombia
-
 Congo
Congo
-
 Costa Rica
-
 Cote d'Ivoire
-
 Croatia
-
 Cuba
Cuba
-
 Cyprus
-
 Czechia
-
 DR Congo
-
 Denmark
-
 Dominican Republic
-
 Ecuador
-
 Egypt
Egypt
-
 El Salvador
-
 Estonia
-
 Eswatini
-
 Ethiopia
-
 Finland
-
 France
-
 Georgia
-
 Germany
-
 Ghana
Ghana
-
 Greece
-
 Haiti
Haiti
-
 Hong Kong
-
 Hungary
-
 India
India
-
 Indonesia
-
 Iran, Islamic republic
-
 Iraq
Iraq
-
 Ireland
-
 Israel
-
 Italy
Italy
-
 Jamaica
-
 Japan
Japan
-
 Jordan
-
 Kazakhstan
-
 Kenya
Kenya
-
 Korea
Korea
-
 Kuwait
-
 Kyrgyzstan
-
 Laos
Laos
-
 Latvia
-
 Lebanon
-
 Lesotho
-
 Libya
Libya
-
 Lithuania
-
 Luxembourg
-
 Madagascar
-
 Malaysia
-
 Malta
Malta
-
 Mauritius
-
 Mexico
-
 Moldova
-
 Mongolia
-
 Montenegro
-
 Morocco
-
 Mozambique
-
 Myanmar
-
 Namibia
-
 Nepal
Nepal
-
 Netherlands
-
 New Zealand
-
 Nigeria
-
 North Macedonia
-
 Norway
-
 Oman
Oman
-
 Pakistan
-
 Palestine
-
 Panama
-
 Papua New Guinea
-
 Paraguay
-
 Peru
Peru
-
 Philippines
-
 Poland
-
 Portugal
-
 Puerto Rico
-
 Qatar
Qatar
-
 Reunion
-
 Romania
-
 Rwanda
-
 Saudi Arabia
-
 Serbia
-
 Singapore
-
 Slovakia
-
 Slovenia
-
 Somalia
-
 South Africa
-
 Spain
Spain
-
 Sri Lanka
-
 Sweden
-
 Switzerland
-
 Syria
Syria
-
 Taiwan
-
 Tajikistan
-
 Tanzania
-
 Thailand
-
 Trinidad and Tobago
-
 Tunisia
-
 Turkey
-
 UAE
UAE
-
 Uganda
-
 Ukraine
-
 United Kingdom
-
United States
-
 Uruguay
-
 Uzbekistan
-
 Venezuela
-
 Vietnam
-
 Yemen
Yemen
-
 Zambia
-
 Zimbabwe
- Forex
- Crypto
