
Apple stock edges higher above key moving averages as bullish momentum persists: weekly outlook

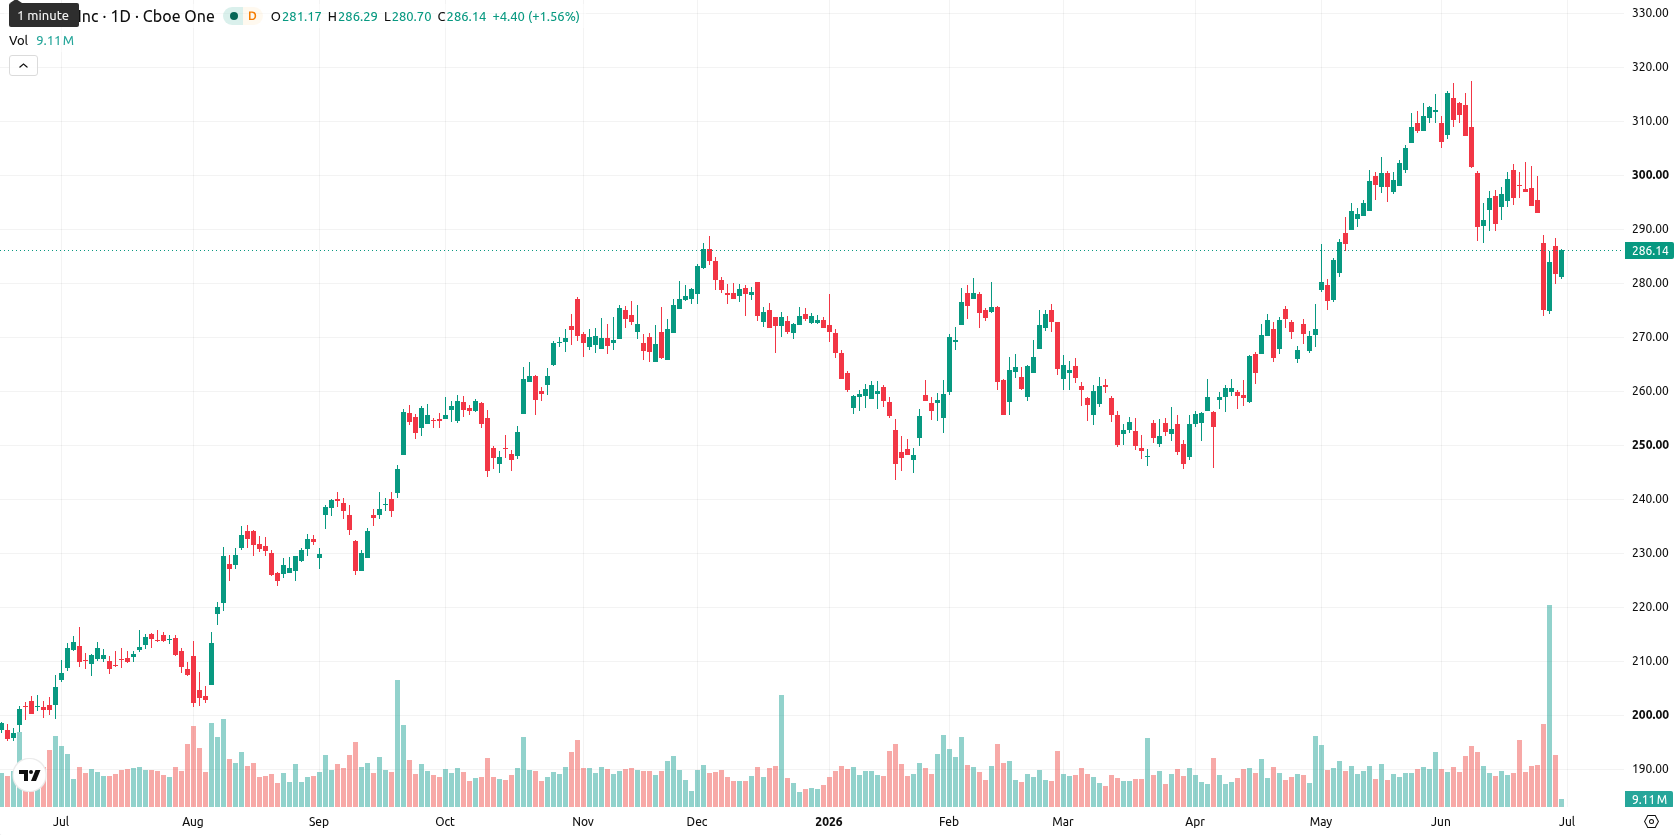
Apple Inc. (AAPL) is currently trading at $285.81, having gained $3.56 (1.25%) over the past week. The price is positioned above its weekly MA-20 ($277.28), MA-50 ($263.37), and MA-200 ($208.33), indicating sustained medium- and long-term bullish support with moderate consolidation.
Highlights
- Apple maintains a strong medium- and long-term uptrend, trading above key moving averages with bullish technical structure.
- Momentum and trend indicators support a 75% probability of further upside, though some short-term oscillators hint at consolidation.
- Near-term trading is expected between $279.00 and $292.00, with a breakout above $292.00 suggesting additional gains, while a drop below $279.00 risks deeper pullbacks.
Price hikes and AI risks shift sentiment amid supply chain pressures
Apple has raised prices across several hardware products following a global memory chip shortage and cost increases, with the company now seeking alternative suppliers and lobbying for approval to source memory chips from China. Apple is also accelerating software updates in response to new AI-driven cybersecurity concerns and recently addressed a leak from manufacturing partner Tata Electronics involving confidential iPhone model information. The company faces ongoing regulatory scrutiny from India's Competition Commission regarding its App Store practices.
Bullish momentum persists as indicators reflect short-term hesitation
On the weekly (W1) chart, AAPL remains above all major moving averages, with MA-20 and MA-50 acting as dynamic support levels. Weekly MACD and ADX show strong bullish momentum, while the RSI and CCI remain in neutral-to-positive territory. Stochastic RSI and Bull/Bear Power hint at an oversold condition within a longer-term uptrend, indicating mild short-term hesitation. Key weekly support is noted at $279.00, with resistance at $292.00.
Upward bias persists next week amid consolidation and breakout risk
For the next 5 trading days, the anticipated range for AAPL is $279.00 to $292.00. With three out of four weekly indicators (RSI, ADX, and MACD) flashing 'Buy' or 'Strong Buy', there is a 75% probability of an upward move, though some consolidation is likely. The baseline scenario suggests the stock will trade sideways between the marked support and resistance, while a breakout above $292.00 could trigger further gains. A move below $279.00 may open the way for additional downside toward key medium-term support.
In a recent review, analysts highlighted that Apple faced persistent supply chain constraints, regulatory scrutiny, and security concerns, leading to cautious sentiment around the stock’s near-term direction. The latest technical signals now reinforce a moderately bullish outlook, making a sustained break above $292.00 the key level to monitor for potential further upside momentum.


-
 Afghanistan
-
 Albania
-
 Algeria
-
 Angola
-
 Argentina
-
 Armenia
-
 Australia
-
 Austria
-
 Azerbaijan
-
 Bahamas
-
 Bahrain
-
 Bangladesh
-
 Belarus
-
 Belgium
-
 Bolivia
-
 Botswana
-
 Brazil
-
 Brunei
-
 Bulgaria
-
 Cambodia
-
 Cameroon
-
 Canada
-
 Chile
Chile
-
 China
China
-
 Colombia
-
 Congo
Congo
-
 Costa Rica
-
 Cote d'Ivoire
-
 Croatia
-
 Cuba
Cuba
-
 Cyprus
-
 Czechia
-
 DR Congo
-
 Denmark
-
 Dominican Republic
-
 Ecuador
-
 Egypt
Egypt
-
 El Salvador
-
 Estonia
-
 Eswatini
-
 Ethiopia
-
 Finland
-
 France
-
 Georgia
-
 Germany
-
 Ghana
Ghana
-
 Greece
-
 Haiti
Haiti
-
 Hong Kong
-
 Hungary
-
 India
India
-
 Indonesia
-
 Iran, Islamic republic
-
 Iraq
Iraq
-
 Ireland
-
 Israel
-
 Italy
Italy
-
 Jamaica
-
 Japan
Japan
-
 Jordan
-
 Kazakhstan
-
 Kenya
Kenya
-
 Korea
Korea
-
 Kuwait
-
 Kyrgyzstan
-
 Laos
Laos
-
 Latvia
-
 Lebanon
-
 Lesotho
-
 Libya
Libya
-
 Lithuania
-
 Luxembourg
-
 Madagascar
-
 Malaysia
-
 Malta
Malta
-
 Mauritius
-
 Mexico
-
 Moldova
-
 Mongolia
-
 Montenegro
-
 Morocco
-
 Mozambique
-
 Myanmar
-
 Namibia
-
 Nepal
Nepal
-
 Netherlands
-
 New Zealand
-
 Nigeria
-
 North Macedonia
-
 Norway
-
 Oman
Oman
-
 Pakistan
-
 Palestine
-
 Panama
-
 Papua New Guinea
-
 Paraguay
-
 Peru
Peru
-
 Philippines
-
 Poland
-
 Portugal
-
 Puerto Rico
-
 Qatar
Qatar
-
 Reunion
-
 Romania
-
 Rwanda
-
 Saudi Arabia
-
 Serbia
-
 Singapore
-
 Slovakia
-
 Slovenia
-
 Somalia
-
 South Africa
-
 Spain
Spain
-
 Sri Lanka
-
 Sweden
-
 Switzerland
-
 Syria
Syria
-
 Taiwan
-
 Tajikistan
-
 Tanzania
-
 Thailand
-
 Trinidad and Tobago
-
 Tunisia
-
 Turkey
-
 UAE
UAE
-
 Uganda
-
 Ukraine
-
 United Kingdom
-
United States
-
 Uruguay
-
 Uzbekistan
-
 Venezuela
-
 Vietnam
-
 Yemen
Yemen
-
 Zambia
-
 Zimbabwe
- Forex
- Crypto
