
Sify Technologies stock gains 3.35% as price clears key moving averages

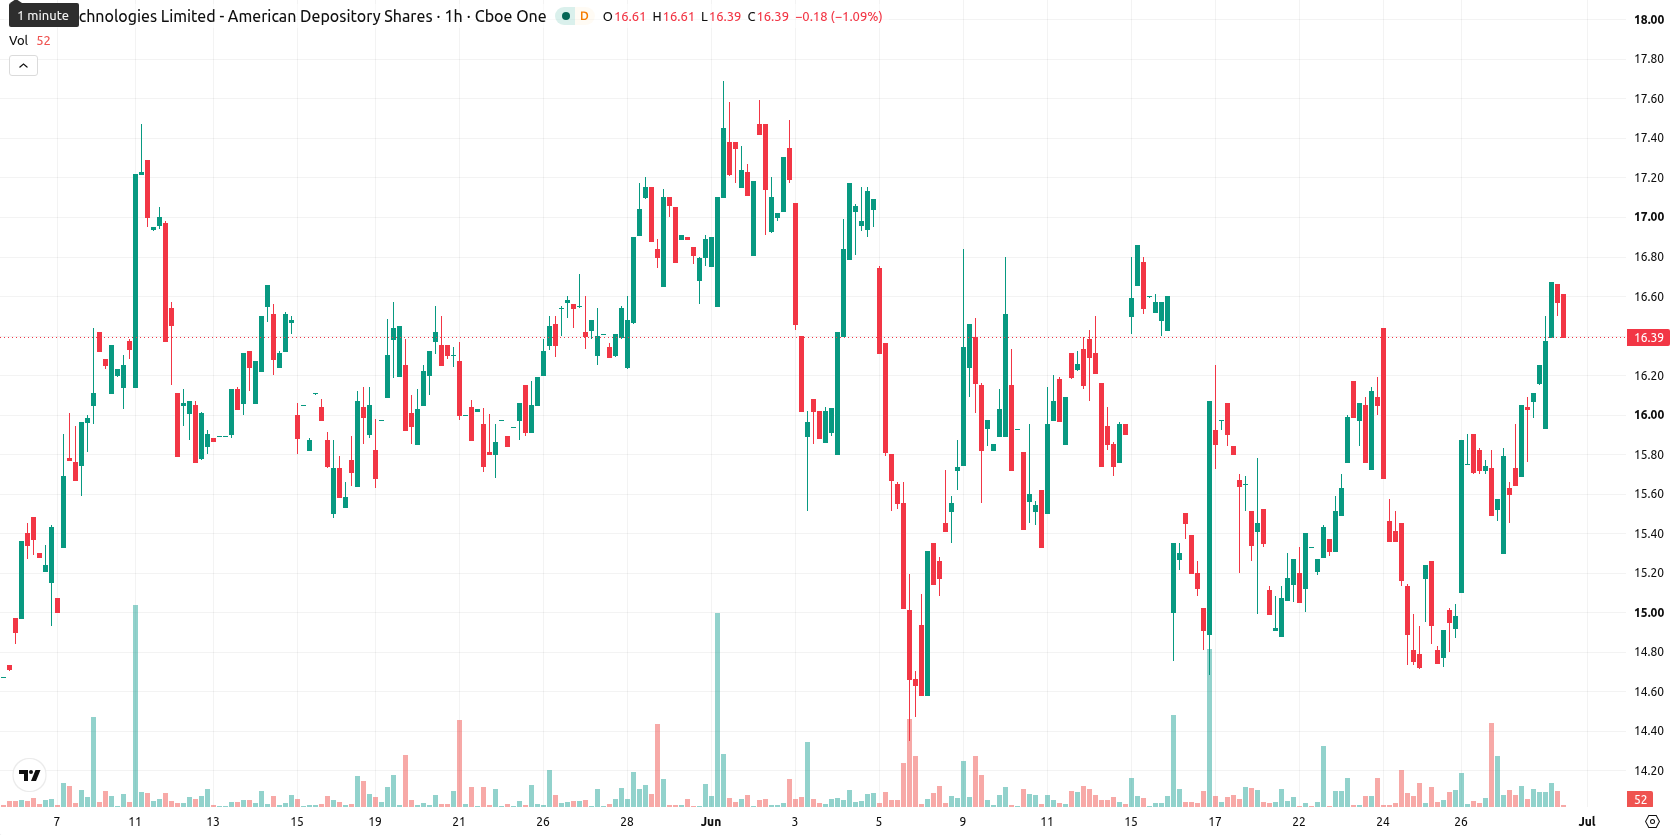
Sify Technologies (SIFY) stock is trading at $16.68, marking a 3.35% move up for the session. The stock is currently positioned above its key moving averages, reflecting solid short-term and long-term momentum.
Highlights
- SIFY/USD maintains a bullish structure across short-, medium-, and long-term trends, trading well above key moving averages.
- Momentum indicators are mixed, with MACD and AO signaling strength but oscillators warn of overbought conditions and potential pullback.
- Price is expected to consolidate in the $15.86–$17.5 range over the next several days, with a 78% probability of further gains.
Diverging oscillator signals amid sustained bullish positioning
SIFY is trading above the MA-20 ($15.89), MA-50 ($15.54), and well above the MA-200 ($13.83), with the Ichimoku Kijun baseline at $15.7 serving as immediate support. Key technical indicators present a mixed outlook: the Moving Average Convergence Divergence (MACD) signals a Buy and the Awesome Oscillator confirms the prevailing uptrend, while the Average Directional Index (ADX) is Neutral. The Relative Strength Index (RSI) reads 65.42 (Buy), but Stochastic RSI signals a Strong Sell, and the Commodity Channel Index (CCI) is in overbought territory, highlighting growing divergence among oscillators. Bull/Bear Power reflects continued buyer dominance with heightened intraday volatility.
Consolidation expected as volatility shapes breakout risk
In the short term, SIFY is likely to trade within the $15.86–$17.5 range, capturing typical volatility around current levels. The base-case scenario envisions price consolidating in this corridor. A bullish continuation could see momentum lifting SIFY above the upper resistance, while a bearish turn would be indicated by a successful break below the $15.7 support level, signaling risk of a corrective move toward lower targets.


-
 Afghanistan
-
 Albania
-
 Algeria
-
 Angola
-
 Argentina
-
 Armenia
-
 Australia
-
 Austria
-
 Azerbaijan
-
 Bahamas
-
 Bahrain
-
 Bangladesh
-
 Belarus
-
 Belgium
-
 Bolivia
-
 Botswana
-
 Brazil
-
 Brunei
-
 Bulgaria
-
 Cambodia
-
 Cameroon
-
 Canada
-
 Chile
Chile
-
 China
China
-
 Colombia
-
 Congo
Congo
-
 Costa Rica
-
 Cote d'Ivoire
-
 Croatia
-
 Cuba
Cuba
-
 Cyprus
-
 Czechia
-
 DR Congo
-
 Denmark
-
 Dominican Republic
-
 Ecuador
-
 Egypt
Egypt
-
 El Salvador
-
 Estonia
-
 Eswatini
-
 Ethiopia
-
 Finland
-
 France
-
 Georgia
-
 Germany
-
 Ghana
Ghana
-
 Greece
-
 Haiti
Haiti
-
 Hong Kong
-
 Hungary
-
 India
India
-
 Indonesia
-
 Iran, Islamic republic
-
 Iraq
Iraq
-
 Ireland
-
 Israel
-
 Italy
Italy
-
 Jamaica
-
 Japan
Japan
-
 Jordan
-
 Kazakhstan
-
 Kenya
Kenya
-
 Korea
Korea
-
 Kuwait
-
 Kyrgyzstan
-
 Laos
Laos
-
 Latvia
-
 Lebanon
-
 Lesotho
-
 Libya
Libya
-
 Lithuania
-
 Luxembourg
-
 Madagascar
-
 Malaysia
-
 Malta
Malta
-
 Mauritius
-
 Mexico
-
 Moldova
-
 Mongolia
-
 Montenegro
-
 Morocco
-
 Mozambique
-
 Myanmar
-
 Namibia
-
 Nepal
Nepal
-
 Netherlands
-
 New Zealand
-
 Nigeria
-
 North Macedonia
-
 Norway
-
 Oman
Oman
-
 Pakistan
-
 Palestine
-
 Panama
-
 Papua New Guinea
-
 Paraguay
-
 Peru
Peru
-
 Philippines
-
 Poland
-
 Portugal
-
 Puerto Rico
-
 Qatar
Qatar
-
 Reunion
-
 Romania
-
 Rwanda
-
 Saudi Arabia
-
 Serbia
-
 Singapore
-
 Slovakia
-
 Slovenia
-
 Somalia
-
 South Africa
-
 Spain
Spain
-
 Sri Lanka
-
 Sweden
-
 Switzerland
-
 Syria
Syria
-
 Taiwan
-
 Tajikistan
-
 Tanzania
-
 Thailand
-
 Trinidad and Tobago
-
 Tunisia
-
 Turkey
-
 UAE
UAE
-
 Uganda
-
 Ukraine
-
 United Kingdom
-
United States
-
 Uruguay
-
 Uzbekistan
-
 Venezuela
-
 Vietnam
-
 Yemen
Yemen
-
 Zambia
-
 Zimbabwe
- Forex
- Crypto
