
$10.92–$11.38 range contains Ericsson stock price movement

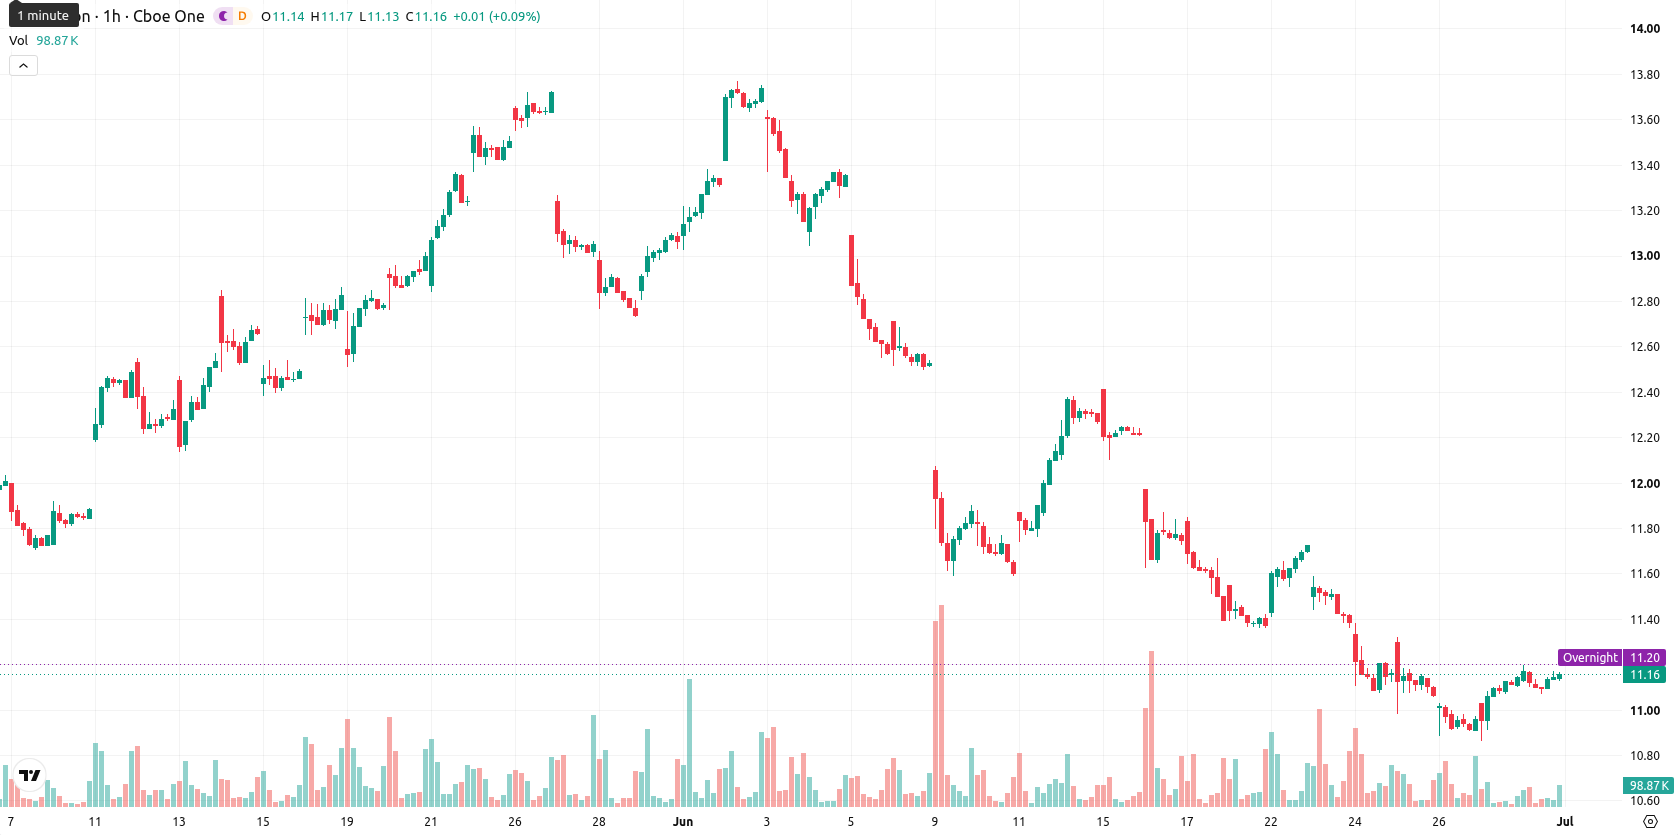
Ericsson (ERIC) stock is trading at $11.15, unchanged for the day, with subdued price action and low volatility. The shares are currently positioned above their short-term averages but below medium-term thresholds, reflecting a stable price environment.
Highlights
- Ericsson repurchased over 6.1 million Class B shares for approximately SEK 675.7 million as part of its ongoing SEK 15 billion buyback initiative.
- The board plans to seek shareholder approval to cancel repurchased shares at the 2027 AGM, potentially reducing share count and boosting per-share metrics.
- Ericsson is rangebound between $10.92 and $11.38 with mixed momentum signals, as technical indicators suggest short-term uncertainty and balanced directional risk.
Buybacks and cancellation plan reduce float as capital return advances
Ericsson repurchased 6,116,402 of its own Class B shares on Nasdaq Stockholm between June 22 and June 26, 2026, at a weighted average price of SEK 110.47 per share, totaling approximately SEK 675.7 million as part of its SEK 15 billion buyback program, according to Tipranks. This action reduces the public float and illustrates an ongoing capital return strategy that can support per-share metrics. Additionally, Finance Yahoo reported that the board plans to propose cancelling these repurchased shares at the 2027 Annual General Meeting, which could further lower share count in the future.
Mixed technical signals as price hovers in low-volatility band
Technical analysis shows ERIC trading above the MA-20 and below the MA-50 on the hourly chart, with price remaining above the MA-200 on the daily timeframe. The Ichimoku Kijun, positioned at $11.03, acts as immediate support. The Relative Strength Index (RSI) is at 51.11, just in buy territory, while the Commodity Channel Index (CCI) and Bull/Bear Power indicate buyer pressure. The Moving Average Convergence Divergence (MACD) signals a strong sell, the Average Directional Index (ADX) is neutral, Stochastic RSI indicates overbought conditions, and the Awesome Oscillator supports an upward trend. Price action is currently subdued in a mid-range context with low volatility.
Rangebound outlook as breakout risk matches support strength
Over the next several trading days, ERIC is expected to fluctuate within a typical volatility band between $10.92 and $11.38. Probabilities for upward or downward movement are evenly balanced at 50% each, and a decisive break out of this range remains equally likely in either direction. The base case is for price to stay rangebound near current levels, with any breakout scenario dependent on a move above near-term resistance or a breach below immediate support.


-
 Afghanistan
-
 Albania
-
 Algeria
-
 Angola
-
 Argentina
-
 Armenia
-
 Australia
-
 Austria
-
 Azerbaijan
-
 Bahamas
-
 Bahrain
-
 Bangladesh
-
 Belarus
-
 Belgium
-
 Bolivia
-
 Botswana
-
 Brazil
-
 Brunei
-
 Bulgaria
-
 Cambodia
-
 Cameroon
-
 Canada
-
 Chile
Chile
-
 China
China
-
 Colombia
-
 Congo
Congo
-
 Costa Rica
-
 Cote d'Ivoire
-
 Croatia
-
 Cuba
Cuba
-
 Cyprus
-
 Czechia
-
 DR Congo
-
 Denmark
-
 Dominican Republic
-
 Ecuador
-
 Egypt
Egypt
-
 El Salvador
-
 Estonia
-
 Eswatini
-
 Ethiopia
-
 Finland
-
 France
-
 Georgia
-
 Germany
-
 Ghana
Ghana
-
 Greece
-
 Haiti
Haiti
-
 Hong Kong
-
 Hungary
-
 India
India
-
 Indonesia
-
 Iran, Islamic republic
-
 Iraq
Iraq
-
 Ireland
-
 Israel
-
 Italy
Italy
-
 Jamaica
-
 Japan
Japan
-
 Jordan
-
 Kazakhstan
-
 Kenya
Kenya
-
 Korea
Korea
-
 Kuwait
-
 Kyrgyzstan
-
 Laos
Laos
-
 Latvia
-
 Lebanon
-
 Lesotho
-
 Libya
Libya
-
 Lithuania
-
 Luxembourg
-
 Madagascar
-
 Malaysia
-
 Malta
Malta
-
 Mauritius
-
 Mexico
-
 Moldova
-
 Mongolia
-
 Montenegro
-
 Morocco
-
 Mozambique
-
 Myanmar
-
 Namibia
-
 Nepal
Nepal
-
 Netherlands
-
 New Zealand
-
 Nigeria
-
 North Macedonia
-
 Norway
-
 Oman
Oman
-
 Pakistan
-
 Palestine
-
 Panama
-
 Papua New Guinea
-
 Paraguay
-
 Peru
Peru
-
 Philippines
-
 Poland
-
 Portugal
-
 Puerto Rico
-
 Qatar
Qatar
-
 Reunion
-
 Romania
-
 Rwanda
-
 Saudi Arabia
-
 Serbia
-
 Singapore
-
 Slovakia
-
 Slovenia
-
 Somalia
-
 South Africa
-
 Spain
Spain
-
 Sri Lanka
-
 Sweden
-
 Switzerland
-
 Syria
Syria
-
 Taiwan
-
 Tajikistan
-
 Tanzania
-
 Thailand
-
 Trinidad and Tobago
-
 Tunisia
-
 Turkey
-
 UAE
UAE
-
 Uganda
-
 Ukraine
-
 United Kingdom
-
United States
-
 Uruguay
-
 Uzbekistan
-
 Venezuela
-
 Vietnam
-
 Yemen
Yemen
-
 Zambia
-
 Zimbabwe
- Forex
- Crypto
