
JetBlue stock price forecast: $6.28 resistance as JBLU rises 3.14%

JetBlue (JBLU) stock is trading at $5.91, up 3.14% on the day. The price sits above its key moving averages, reflecting strength across short-, medium-, and long-term trends.
 6.12
6.27
6.12
6.27
Highlights
- JetBlue reinforced brand engagement by unveiling a special livery and launching a patriotic campaign for the U.S. 250th anniversary.
- A recent drone strike incident at JFK caused no aircraft damage or service disruption, emphasizing operational resilience.
- JBLU maintains a bullish technical setup, trading above key supports, with an expected range of $5.54–$6.28 for the coming days.
Brand initiatives and operational resilience drive sentiment after drone incident
JetBlue has reinforced its brand presence by unveiling a special "250" commemorative livery on its "Vets in Blue" aircraft to mark the United States' 250th anniversary, with the updated design showcased at Ronald Reagan Washington National Airport, according to Streetinsider. This initiative, along with a dedicated inflight video honoring the nation and military veterans narrated by Chief Operating Officer Warren Christie, underscores strong community ties and aims to deepen passenger engagement throughout July. In operational developments, JetBlue reported an incident on June 29 involving a drone strike near John F. Kennedy International Airport, though Financialexpress noted that the aircraft suffered no damage, averting any service disruption.
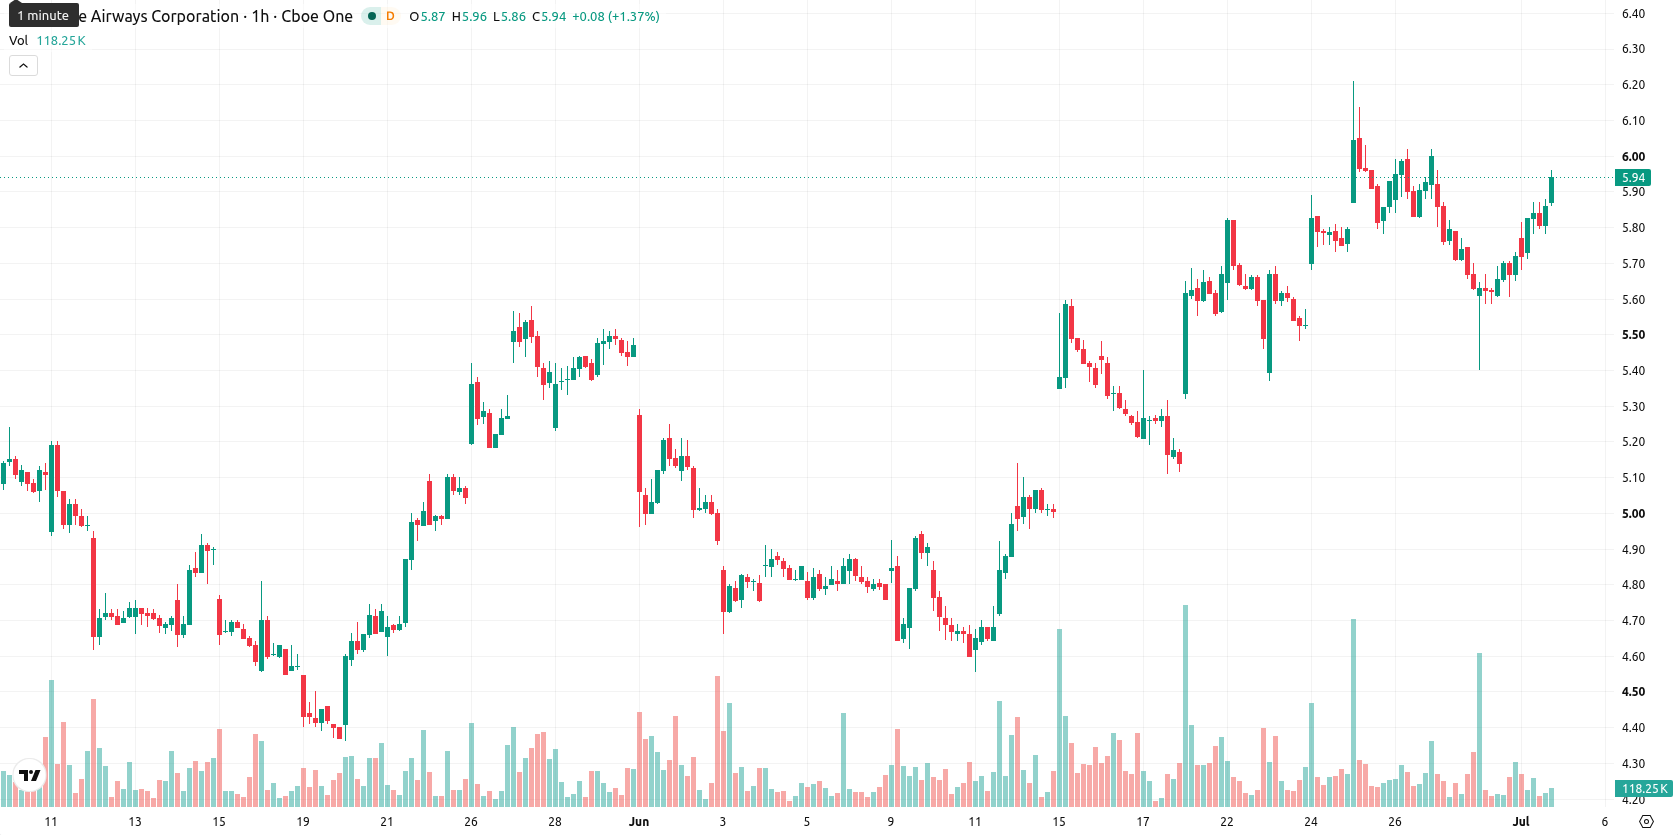
Bullish momentum supported as mixed indicators highlight overbought risk
JBLU is currently trading above its 20-day moving average at $5.74, its 50-day at $5.77, and remains well above the 200-day level at $4.91. The Ichimoku Kijun provides near-term support at $5.71. Technical momentum is mixed: the Relative Strength Index (RSI) stands at 59.34 (Buy signal), while both the Moving Average Convergence Divergence (MACD) and Average Directional Index (ADX) are Neutral. Both Stochastic RSI and the Commodity Channel Index (CCI) indicate overbought conditions, and Bull/Bear Power shows buyers dominating in the intraday session. The Awesome Oscillator gives a Strong Buy reading, supporting continued bullish momentum, though oscillators warn of possible short-term exhaustion among new buyers.
Range-bound outlook as volatility shapes potential breakout or reversal
Over the next several days, JBLU is expected to trade within the $5.54 to $6.28 range, forming a sideways corridor that reflects current volatility levels. There is a 76% probability of continued upside movement versus a 24% chance of a down move. The baseline scenario is for the stock to remain range-bound, but a break above resistance could trigger further gains, while a loss of support at $5.71 could lead to a reversal.
Earlier, analysts noted that JetBlue was at a technical crossroads, with mixed signals contributing to uncertainty in its near-term direction. The current setup, marked by continued bullish momentum but caution from overbought oscillators, makes monitoring potential breakouts above $6.28 especially important for traders watching for a shift out of the established range.





Latest JetBlue News







-
 Afghanistan
-
 Albania
-
 Algeria
-
 Angola
-
 Argentina
-
 Armenia
-
 Australia
-
 Austria
-
 Azerbaijan
-
 Bahamas
-
 Bahrain
-
 Bangladesh
-
 Belarus
-
 Belgium
-
 Bolivia
-
 Botswana
-
 Brazil
-
 Brunei
-
 Bulgaria
-
 Cambodia
-
 Cameroon
-
 Canada
-
 Chile
Chile
-
 China
China
-
 Colombia
-
 Congo
Congo
-
 Costa Rica
-
 Cote d'Ivoire
-
 Croatia
-
 Cuba
Cuba
-
 Cyprus
-
 Czechia
-
 DR Congo
-
 Denmark
-
 Dominican Republic
-
 Ecuador
-
 Egypt
Egypt
-
 El Salvador
-
 Estonia
-
 Eswatini
-
 Ethiopia
-
 Finland
-
 France
-
 Georgia
-
 Germany
-
 Ghana
Ghana
-
 Greece
-
 Haiti
Haiti
-
 Hong Kong
-
 Hungary
-
 India
India
-
 Indonesia
-
 Iran, Islamic republic
-
 Iraq
Iraq
-
 Ireland
-
 Israel
-
 Italy
Italy
-
 Jamaica
-
 Japan
Japan
-
 Jordan
-
 Kazakhstan
-
 Kenya
Kenya
-
 Korea
Korea
-
 Kuwait
-
 Kyrgyzstan
-
 Laos
Laos
-
 Latvia
-
 Lebanon
-
 Lesotho
-
 Libya
Libya
-
 Lithuania
-
 Luxembourg
-
 Madagascar
-
 Malaysia
-
 Malta
Malta
-
 Mauritius
-
 Mexico
-
 Moldova
-
 Mongolia
-
 Montenegro
-
 Morocco
-
 Mozambique
-
 Myanmar
-
 Namibia
-
 Nepal
Nepal
-
 Netherlands
-
 New Zealand
-
 Nigeria
-
 North Macedonia
-
 Norway
-
 Oman
Oman
-
 Pakistan
-
 Palestine
-
 Panama
-
 Papua New Guinea
-
 Paraguay
-
 Peru
Peru
-
 Philippines
-
 Poland
-
 Portugal
-
 Puerto Rico
-
 Qatar
Qatar
-
 Reunion
-
 Romania
-
 Rwanda
-
 Saudi Arabia
-
 Serbia
-
 Singapore
-
 Slovakia
-
 Slovenia
-
 Somalia
-
 South Africa
-
 Spain
Spain
-
 Sri Lanka
-
 Sweden
-
 Switzerland
-
 Syria
Syria
-
 Taiwan
-
 Tajikistan
-
 Tanzania
-
 Thailand
-
 Trinidad and Tobago
-
 Tunisia
-
 Turkey
-
 UAE
UAE
-
 Uganda
-
 Ukraine
-
 United Kingdom
-
United States
-
 Uruguay
-
 Uzbekistan
-
 Venezuela
-
 Vietnam
-
 Yemen
Yemen
-
 Zambia
-
 Zimbabwe
- Forex
- Crypto











