
JetBlue Airways stock price forecast: $5.39 support key as JBLU falls 3.88%

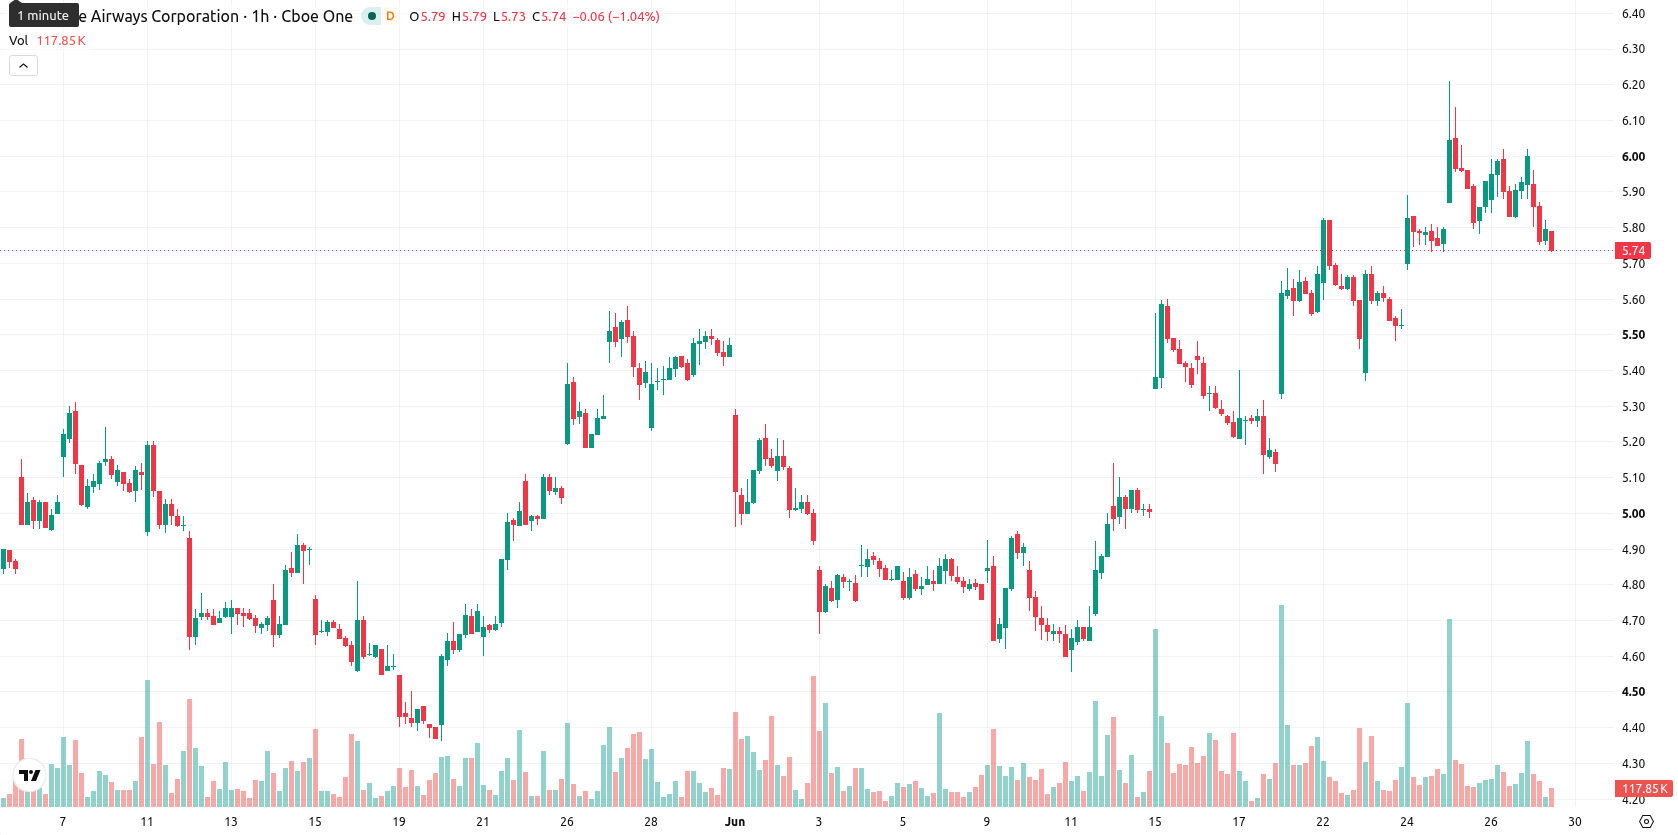
JetBlue Airways (JBLU) stock is trading at $5.77, down 3.88% on the day. The price action places JBLU below its key moving averages on the short-term timeframe, indicating immediate downward pressure.
Highlights
- JBLU shows short-term selling pressure with price losing 3.88% intraday and trading near daily lows amid volatility.
- Momentum and oscillator signals diverge, suggesting uncertainty as some indicators flash buy and others indicate persistent bearishness.
- Price is expected to remain in the $5.39–$6.15 corridor, with breakout over $5.85 offering upside, but downside risk remains if selling persists.
Mixed momentum and oscillator signals as seller pressure persists
On the technical front, JBLU is trading below the 20-day moving average ($5.89), above the 50-day moving average ($5.69), and well above the 200-day moving average ($4.91). The Ichimoku Kijun sits at $5.85 and currently serves as immediate resistance. Among momentum and oscillator readings, the Moving Average Convergence Divergence (MACD) issues a Strong Buy signal, while the Average Directional Index (ADX) indicates Buy. However, the Relative Strength Index (RSI) measures 49.43 with a Sell signal, the Commodity Channel Index (CCI) also signals Sell, Stochastic RSI shows Oversold conditions, and Bull/Bear Power highlights dominant seller activity intraday. The Awesome Oscillator is neutral. These mixed indicators suggest a divergence between momentum and oscillators, with day-trading direction still pressured by sellers.
Sideways price bias as volatility and modest bullish tilt guide outlook
Over the next several sessions, JBLU is expected to trade within a band between $5.39 and $6.15, reflecting typical volatility for the period. The base case is for the price to move sideways inside this range. If buyers push above resistance at $5.85, further upside is possible, while a failure to hold support could see the price move towards the lower end of the projected corridor. Probabilities currently favor an upward move, though only marginally, with the scenario split at 55% for gains and 45% for declines.
Earlier, analysts noted that JetBlue’s bullish momentum was underpinned by strong technicals and robust strategic initiatives in key leisure travel markets. The current mixed momentum and oscillator signals reflect a market at a crossroads, making sustained movement above $5.85 a pivotal trigger for confirmation of any near-term recovery.


Latest JetBlue News


-
 Afghanistan
-
 Albania
-
 Algeria
-
 Angola
-
 Argentina
-
 Armenia
-
 Australia
-
 Austria
-
 Azerbaijan
-
 Bahamas
-
 Bahrain
-
 Bangladesh
-
 Belarus
-
 Belgium
-
 Bolivia
-
 Botswana
-
 Brazil
-
 Brunei
-
 Bulgaria
-
 Cambodia
-
 Cameroon
-
 Canada
-
 Chile
Chile
-
 China
China
-
 Colombia
-
 Congo
Congo
-
 Costa Rica
-
 Cote d'Ivoire
-
 Croatia
-
 Cuba
Cuba
-
 Cyprus
-
 Czechia
-
 DR Congo
-
 Denmark
-
 Dominican Republic
-
 Ecuador
-
 Egypt
Egypt
-
 El Salvador
-
 Estonia
-
 Eswatini
-
 Ethiopia
-
 Finland
-
 France
-
 Georgia
-
 Germany
-
 Ghana
Ghana
-
 Greece
-
 Haiti
Haiti
-
 Hong Kong
-
 Hungary
-
 India
India
-
 Indonesia
-
 Iran, Islamic republic
-
 Iraq
Iraq
-
 Ireland
-
 Israel
-
 Italy
Italy
-
 Jamaica
-
 Japan
Japan
-
 Jordan
-
 Kazakhstan
-
 Kenya
Kenya
-
 Korea
Korea
-
 Kuwait
-
 Kyrgyzstan
-
 Laos
Laos
-
 Latvia
-
 Lebanon
-
 Lesotho
-
 Libya
Libya
-
 Lithuania
-
 Luxembourg
-
 Madagascar
-
 Malaysia
-
 Malta
Malta
-
 Mauritius
-
 Mexico
-
 Moldova
-
 Mongolia
-
 Montenegro
-
 Morocco
-
 Mozambique
-
 Myanmar
-
 Namibia
-
 Nepal
Nepal
-
 Netherlands
-
 New Zealand
-
 Nigeria
-
 North Macedonia
-
 Norway
-
 Oman
Oman
-
 Pakistan
-
 Palestine
-
 Panama
-
 Papua New Guinea
-
 Paraguay
-
 Peru
Peru
-
 Philippines
-
 Poland
-
 Portugal
-
 Puerto Rico
-
 Qatar
Qatar
-
 Reunion
-
 Romania
-
 Rwanda
-
 Saudi Arabia
-
 Serbia
-
 Singapore
-
 Slovakia
-
 Slovenia
-
 Somalia
-
 South Africa
-
 Spain
Spain
-
 Sri Lanka
-
 Sweden
-
 Switzerland
-
 Syria
Syria
-
 Taiwan
-
 Tajikistan
-
 Tanzania
-
 Thailand
-
 Trinidad and Tobago
-
 Tunisia
-
 Turkey
-
 UAE
UAE
-
 Uganda
-
 Ukraine
-
 United Kingdom
-
United States
-
 Uruguay
-
 Uzbekistan
-
 Venezuela
-
 Vietnam
-
 Yemen
Yemen
-
 Zambia
-
 Zimbabwe
- Forex
- Crypto
