

Walmart stock declines with negative momentum signals dominating: weekly forecast

Walmart Inc. (WMT) shares are trading at $111.84, which is below both the weekly MA-20 at $123.36 and MA-50 at $114.34, but well above the long-term MA-200 at $77.82. Over the past week, Walmart has declined by $3.85 (3.33%), currently sitting in the middle of the weekly range and reflecting ongoing medium-term downward pressure, while the long-term structure remains bullish with the MA-200 acting as strong support.
 114.83
113.14
114.83
113.14
Highlights
- Walmart shares are under medium-term pressure, trading below key moving averages but still holding above long-term support.
- Momentum indicators trend negatively, with MACD and ADX confirming a bearish bias and oscillators reflecting oversold conditions.
- The anticipated price range for the next week is $109.70 to $114.00, with downside risk outweighing rebound potential.
Rebound attempts as July news offsets profit and inventory concerns
Walmart experienced a rebound in early July 2026 following a prior sell-off tied to concerns over slowing U.S. comparable sales and ongoing inventory management focus, as highlighted by Cleveland Research. Several company directors, including Carla A. Harris, Sarah Friar, Cesar Conde, Shishir Mehrotra, and Gregory Boyd Penner, received quarterly stock awards as part of their compensation. Additionally, Executive Vice President Daniel J. Bartlett sold 3,775 shares in a pre-arranged trading plan. Walmart continues to emphasize strength in profitability and investment in higher-margin growth initiatives such as e-commerce and advertising platforms.
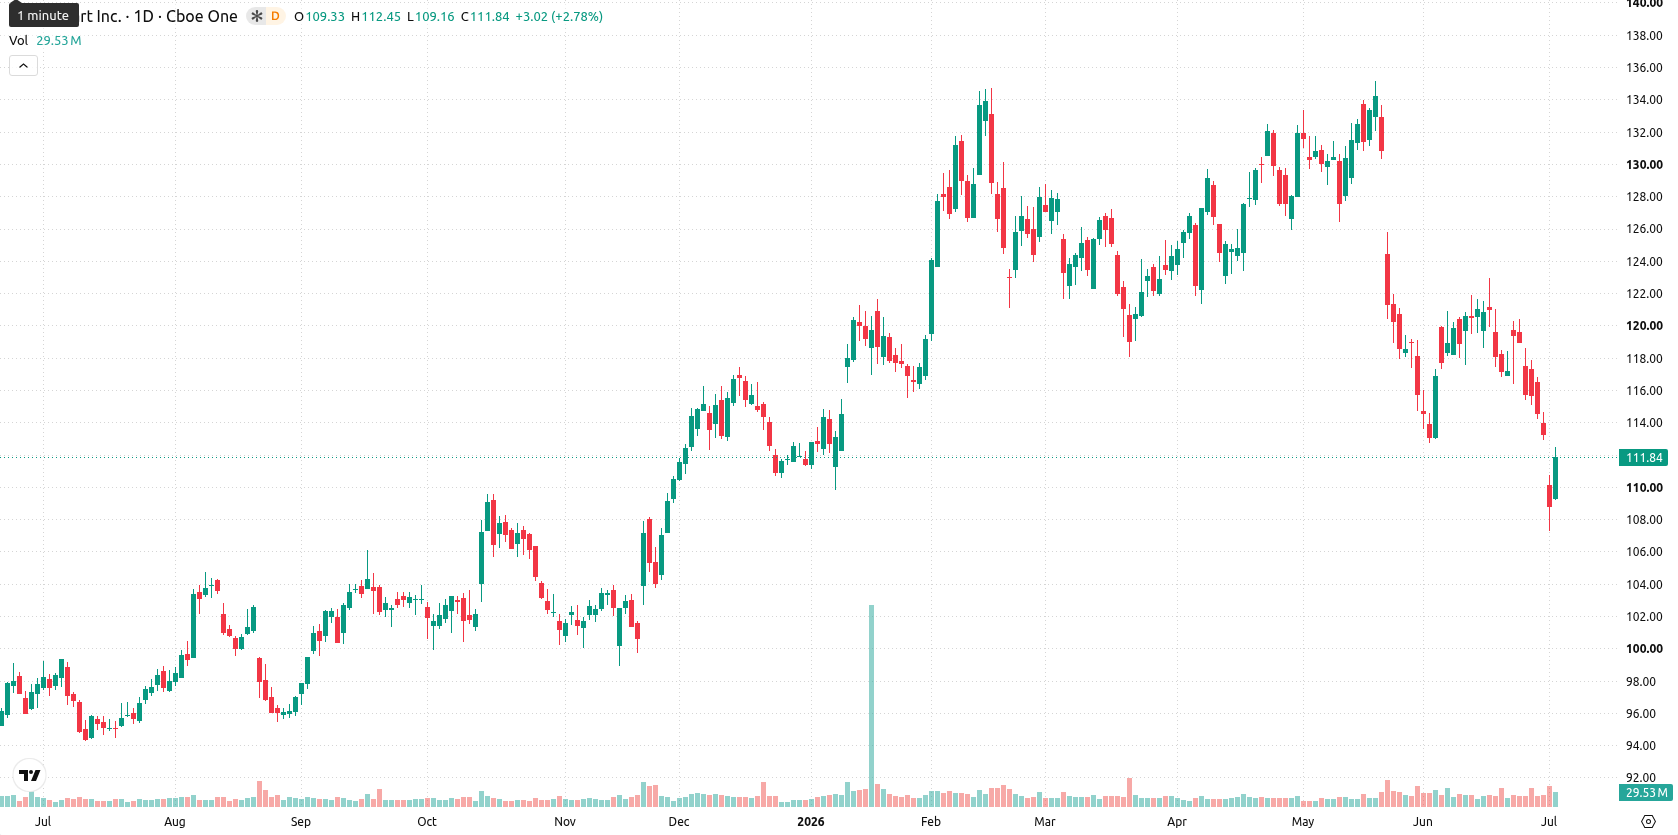
Sustained downtrend as bearish momentum persists despite oversold signals
On the weekly chart, Walmart remains under its MA-20 and MA-50, indicating a sustained medium-term downtrend, while holding well above the MA-200, which offers long-term support. Weekly support is identified at $109.70, with resistance around $114.00. Momentum indicators signal negative sentiment: the MACD is neutral but leaning downward, the ADX flags a sell bias, and Bull/Bear Power remains strongly negative. However, the RSI, Stochastic RSI, and CCI all flag oversold conditions, suggesting selling may be losing steam.
Sideways range expected as oversold conditions curb breakout risks
For the next five trading days, technicals point to a likely sideways consolidation within the $109.70 – $114.00 range, aligning with recent oversold signals and exhaustion in momentum. Upside potential is limited, with less than a 20% probability of a breakout above $114.00, since none of the key indicators offer a buy signal on the weekly timeframe. A bullish scenario requires a move above $114.00, while a sustained drop below $109.70 would reinforce the recent bearish trend and open the door to further weakness.
Earlier, analysts noted that Walmart faced ongoing downside pressure and uncertain directionality amid mixed momentum signals and cautious trading sentiment. The current technical setup not only reinforces this cautious stance but also highlights that failure to hold support at $109.70 could accelerate downside risk in coming sessions.





Latest Walmart News





-
 Afghanistan
-
 Albania
-
 Algeria
-
 Angola
-
 Argentina
-
 Armenia
-
 Australia
-
 Austria
-
 Azerbaijan
-
 Bahamas
-
 Bahrain
-
 Bangladesh
-
 Belarus
-
 Belgium
-
 Bolivia
-
 Botswana
-
 Brazil
-
 Brunei
-
 Bulgaria
-
 Cambodia
-
 Cameroon
-
 Canada
-
 Chile
Chile
-
 China
China
-
 Colombia
-
 Congo
Congo
-
 Costa Rica
-
 Cote d'Ivoire
-
 Croatia
-
 Cuba
Cuba
-
 Cyprus
-
 Czechia
-
 DR Congo
-
 Denmark
-
 Dominican Republic
-
 Ecuador
-
 Egypt
Egypt
-
 El Salvador
-
 Estonia
-
 Eswatini
-
 Ethiopia
-
 Finland
-
 France
-
 Georgia
-
 Germany
-
 Ghana
Ghana
-
 Greece
-
 Haiti
Haiti
-
 Hong Kong
-
 Hungary
-
 India
India
-
 Indonesia
-
 Iran, Islamic republic
-
 Iraq
Iraq
-
 Ireland
-
 Israel
-
 Italy
Italy
-
 Jamaica
-
 Japan
Japan
-
 Jordan
-
 Kazakhstan
-
 Kenya
Kenya
-
 Korea
Korea
-
 Kuwait
-
 Kyrgyzstan
-
 Laos
Laos
-
 Latvia
-
 Lebanon
-
 Lesotho
-
 Libya
Libya
-
 Lithuania
-
 Luxembourg
-
 Madagascar
-
 Malaysia
-
 Malta
Malta
-
 Mauritius
-
 Mexico
-
 Moldova
-
 Mongolia
-
 Montenegro
-
 Morocco
-
 Mozambique
-
 Myanmar
-
 Namibia
-
 Nepal
Nepal
-
 Netherlands
-
 New Zealand
-
 Nigeria
-
 North Macedonia
-
 Norway
-
 Oman
Oman
-
 Pakistan
-
 Palestine
-
 Panama
-
 Papua New Guinea
-
 Paraguay
-
 Peru
Peru
-
 Philippines
-
 Poland
-
 Portugal
-
 Puerto Rico
-
 Qatar
Qatar
-
 Reunion
-
 Romania
-
 Rwanda
-
 Saudi Arabia
-
 Serbia
-
 Singapore
-
 Slovakia
-
 Slovenia
-
 Somalia
-
 South Africa
-
 Spain
Spain
-
 Sri Lanka
-
 Sweden
-
 Switzerland
-
 Syria
Syria
-
 Taiwan
-
 Tajikistan
-
 Tanzania
-
 Thailand
-
 Trinidad and Tobago
-
 Tunisia
-
 Turkey
-
 UAE
UAE
-
 Uganda
-
 Ukraine
-
 United Kingdom
-
United States
-
 Uruguay
-
 Uzbekistan
-
 Venezuela
-
 Vietnam
-
 Yemen
Yemen
-
 Zambia
-
 Zimbabwe
- Forex
- Crypto












