

Walmart stock rises 2.46% as nuclear power agreement with Constellation drives momentum

Walmart Inc. (WMT) stock is trading at $111.5, up 2.46% intraday and near the session’s high. The price currently remains below its key moving averages, reflecting a period of short-term resilience amid generally weak technical signals.
 114.74
114.74
114.74
Highlights
- Walmart faces short-term revenue headwinds as Cleveland Research reports slowing U.S. comparable store sales and moderating customer traffic.
- The company secured a 176-megawatt nuclear power agreement, signaling a commitment to energy diversification and long-term sustainability.
- Technically, WMT/USD remains under bearish pressure, with trading signals suggesting a 74% probability of a downward move within a $106.84–$116.16 range.
Sales slowdown and energy deal shift market focus
Walmart's latest trading session is influenced by a report from Cleveland Research indicating a slowdown in U.S. comparable store sales, which highlights moderating customer traffic and points to potential short-term headwinds for the company's core retail business. This development has heightened market scrutiny around near-term revenue trends and consumer demand, according to Tradingkey and Benzinga. Separately, Walmart has entered into its first nuclear power agreement, securing 176 megawatts from the Dresden Clean Energy Center in Illinois with Constellation, a move that demonstrates the company's push to diversify its energy portfolio and address long-term operational sustainability, as noted by Foxbusiness.
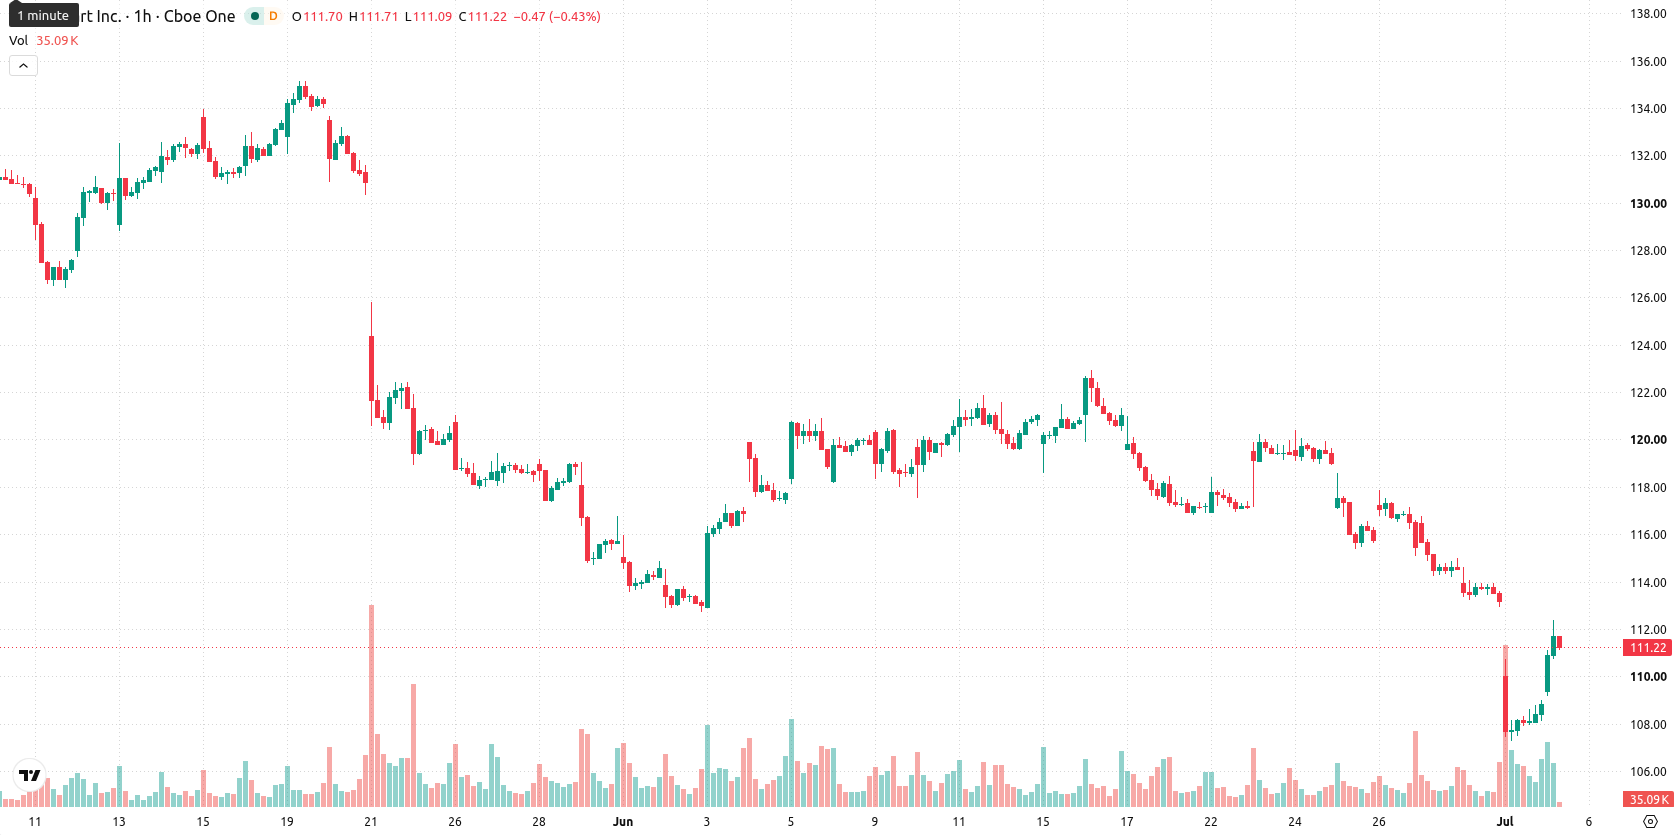
Bearish momentum persists as resistance and indicator signals diverge
On the hourly chart, WMT is trading below the MA-20 at $111.62, the MA-50 at $115.26, and the long-term MA-200 at $117.02. Immediate resistance is defined by the Ichimoku Kijun level at $112.2. Among momentum signals, the Moving Average Convergence Divergence (MACD) remains in a Strong Sell configuration, while the Average Directional Index (ADX) also indicates a Sell. The Relative Strength Index (RSI) points to a Sell due to waning upside strength, even as both the Stochastic RSI and Bull/Bear Power are flagged as overbought, reflecting an unusual divergence as buyers show short-term activity within an overall bearish momentum context. The Commodity Channel Index (CCI) and Awesome Oscillator are neutral, adding further complexity to short-term direction.
Sideways movement projected as downside risk dominates forecast
In the next two to three trading days, WMT is expected to fluctuate within a typical volatility band between $106.84 and $116.16. The scenario analysis assigns a 74% chance to a downward move and a 26% likelihood to an upward breakout. The baseline expectation is for continued sideways movement in this range, with the bullish case requiring a move above immediate resistance, while the bearish scenario would be triggered if the price drops below key support.
Earlier, analysts noted that persistent downside pressure and ongoing technical weakness were dominant themes in Walmart’s recent price action. The latest developments—ranging from mixed momentum readings to a slowdown in core U.S. retail sales and the company’s strategic clean energy initiative—add both caution and complexity for traders, with heightened volatility making directionality uncertain and underscoring the need to closely watch whether price action resolves above resistance or below key support in the days ahead.





Latest Walmart News






-
 Afghanistan
-
 Albania
-
 Algeria
-
 Angola
-
 Argentina
-
 Armenia
-
 Australia
-
 Austria
-
 Azerbaijan
-
 Bahamas
-
 Bahrain
-
 Bangladesh
-
 Belarus
-
 Belgium
-
 Bolivia
-
 Botswana
-
 Brazil
-
 Brunei
-
 Bulgaria
-
 Cambodia
-
 Cameroon
-
 Canada
-
 Chile
Chile
-
 China
China
-
 Colombia
-
 Congo
Congo
-
 Costa Rica
-
 Cote d'Ivoire
-
 Croatia
-
 Cuba
Cuba
-
 Cyprus
-
 Czechia
-
 DR Congo
-
 Denmark
-
 Dominican Republic
-
 Ecuador
-
 Egypt
Egypt
-
 El Salvador
-
 Estonia
-
 Eswatini
-
 Ethiopia
-
 Finland
-
 France
-
 Georgia
-
 Germany
-
 Ghana
Ghana
-
 Greece
-
 Haiti
Haiti
-
 Hong Kong
-
 Hungary
-
 India
India
-
 Indonesia
-
 Iran, Islamic republic
-
 Iraq
Iraq
-
 Ireland
-
 Israel
-
 Italy
Italy
-
 Jamaica
-
 Japan
Japan
-
 Jordan
-
 Kazakhstan
-
 Kenya
Kenya
-
 Korea
Korea
-
 Kuwait
-
 Kyrgyzstan
-
 Laos
Laos
-
 Latvia
-
 Lebanon
-
 Lesotho
-
 Libya
Libya
-
 Lithuania
-
 Luxembourg
-
 Madagascar
-
 Malaysia
-
 Malta
Malta
-
 Mauritius
-
 Mexico
-
 Moldova
-
 Mongolia
-
 Montenegro
-
 Morocco
-
 Mozambique
-
 Myanmar
-
 Namibia
-
 Nepal
Nepal
-
 Netherlands
-
 New Zealand
-
 Nigeria
-
 North Macedonia
-
 Norway
-
 Oman
Oman
-
 Pakistan
-
 Palestine
-
 Panama
-
 Papua New Guinea
-
 Paraguay
-
 Peru
Peru
-
 Philippines
-
 Poland
-
 Portugal
-
 Puerto Rico
-
 Qatar
Qatar
-
 Reunion
-
 Romania
-
 Rwanda
-
 Saudi Arabia
-
 Serbia
-
 Singapore
-
 Slovakia
-
 Slovenia
-
 Somalia
-
 South Africa
-
 Spain
Spain
-
 Sri Lanka
-
 Sweden
-
 Switzerland
-
 Syria
Syria
-
 Taiwan
-
 Tajikistan
-
 Tanzania
-
 Thailand
-
 Trinidad and Tobago
-
 Tunisia
-
 Turkey
-
 UAE
UAE
-
 Uganda
-
 Ukraine
-
 United Kingdom
-
United States
-
 Uruguay
-
 Uzbekistan
-
 Venezuela
-
 Vietnam
-
 Yemen
Yemen
-
 Zambia
-
 Zimbabwe
- Forex
- Crypto












