
CME Group shares gain over 3% after strong buyer interest but rally appears stretched

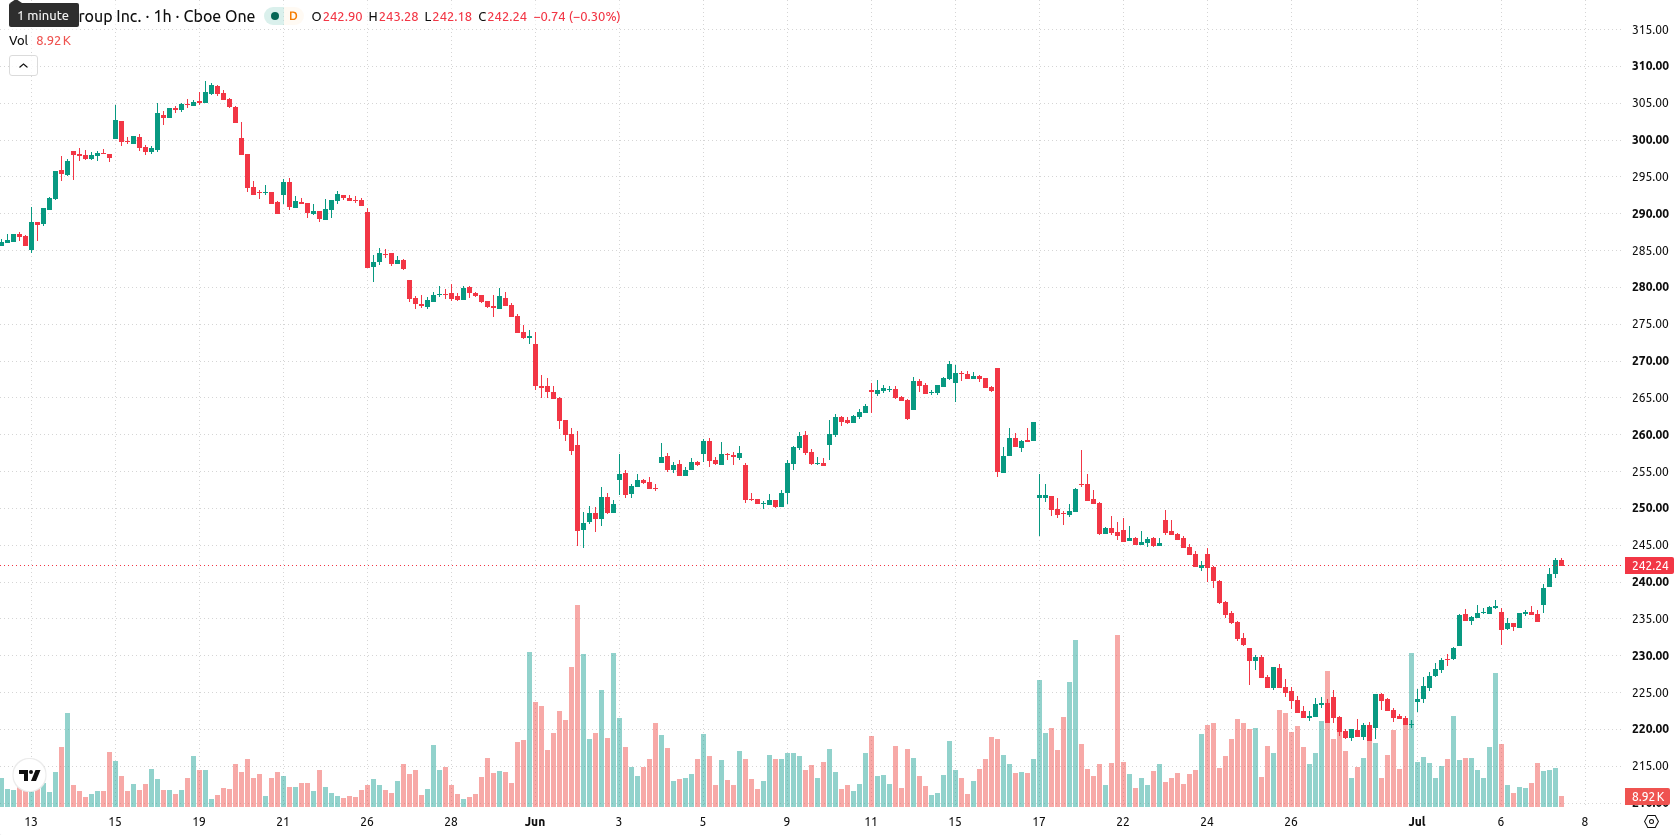
CME Group (CME) stock is trading at $242.57, advancing 3.33% on the day. The price is positioned above its key moving averages, reflecting short- and medium-term strength while still encountering resistance from longer-term levels.
 243.18
243.18
243.18
Highlights
- CME maintains strong short- and medium-term bullish momentum, with price action supported by upward-moving averages and buyer pressure.
- Momentum and oscillator readings indicate a stretched rally, with multiple signals pointing to overbought intraday conditions.
- Expected range for CME over the next sessions is $235.87 to $249.27, with a 73% probability favoring continued upside.
Strong momentum as overbought signals emerge above key supports
On the technical front, CME is trading above the MA-20 at $235.19 and MA-50 at $227.86, but remains below the MA-200 at $280.08. The immediate support is marked by the Ichimoku Kijun at $230.9. Momentum indicators are firmly positive, with the Moving Average Convergence Divergence (MACD) and Average Directional Index (ADX) both giving buy signals, and the Awesome Oscillator also supporting the upside. The Relative Strength Index (RSI) stands at 71.24, in the buy zone, while overbought signals are noted in the Stochastic RSI, Commodity Channel Index (CCI), and Bull/Bear Power, reflecting strong buyer presence but short-term risks of a stretched rally.
Probable upside as volatility and breakout risks define short-term range
In the short term, CME is expected to fluctuate within a range of $235.87 to $249.27, reflecting typical volatility relative to current levels. With a 73% probability of further gains, the most likely scenario is continued upward movement, although a sideways consolidation within the range is also plausible. A break above $249.27 could trigger additional buying momentum, while a fall below $235.87 support would increase the risk of further downside action.
Earlier, analysts noted that CME Group was mired in a broad-based downtrend, with persistent seller pressure and low upside probability. The recent shift in technical momentum and return of strong buyer activity signal a potential reversal, making a sustained move above $249.27 an important level to watch for confirmation of renewed bullish strength.












-
 Afghanistan
-
 Albania
-
 Algeria
-
 Angola
-
 Argentina
-
 Armenia
-
 Australia
-
 Austria
-
 Azerbaijan
-
 Bahamas
-
 Bahrain
-
 Bangladesh
-
 Belarus
-
 Belgium
-
 Bolivia
-
 Botswana
-
 Brazil
-
 Brunei
-
 Bulgaria
-
 Cambodia
-
 Cameroon
-
 Canada
-
 Chile
Chile
-
 China
China
-
 Colombia
-
 Congo
Congo
-
 Costa Rica
-
 Cote d'Ivoire
-
 Croatia
-
 Cuba
Cuba
-
 Cyprus
-
 Czechia
-
 DR Congo
-
 Denmark
-
 Dominican Republic
-
 Ecuador
-
 Egypt
Egypt
-
 El Salvador
-
 Estonia
-
 Eswatini
-
 Ethiopia
-
 Finland
-
 France
-
 Georgia
-
 Germany
-
 Ghana
Ghana
-
 Greece
-
 Haiti
Haiti
-
 Hong Kong
-
 Hungary
-
 India
India
-
 Indonesia
-
 Iran, Islamic republic
-
 Iraq
Iraq
-
 Ireland
-
 Israel
-
 Italy
Italy
-
 Jamaica
-
 Japan
Japan
-
 Jordan
-
 Kazakhstan
-
 Kenya
Kenya
-
 Korea
Korea
-
 Kuwait
-
 Kyrgyzstan
-
 Laos
Laos
-
 Latvia
-
 Lebanon
-
 Lesotho
-
 Libya
Libya
-
 Lithuania
-
 Luxembourg
-
 Madagascar
-
 Malaysia
-
 Malta
Malta
-
 Mauritius
-
 Mexico
-
 Moldova
-
 Mongolia
-
 Montenegro
-
 Morocco
-
 Mozambique
-
 Myanmar
-
 Namibia
-
 Nepal
Nepal
-
 Netherlands
-
 New Zealand
-
 Nigeria
-
 North Macedonia
-
 Norway
-
 Oman
Oman
-
 Pakistan
-
 Palestine
-
 Panama
-
 Papua New Guinea
-
 Paraguay
-
 Peru
Peru
-
 Philippines
-
 Poland
-
 Portugal
-
 Puerto Rico
-
 Qatar
Qatar
-
 Reunion
-
 Romania
-
 Rwanda
-
 Saudi Arabia
-
 Serbia
-
 Singapore
-
 Slovakia
-
 Slovenia
-
 Somalia
-
 South Africa
-
 Spain
Spain
-
 Sri Lanka
-
 Sweden
-
 Switzerland
-
 Syria
Syria
-
 Taiwan
-
 Tajikistan
-
 Tanzania
-
 Thailand
-
 Trinidad and Tobago
-
 Tunisia
-
 Turkey
-
 UAE
UAE
-
 Uganda
-
 Ukraine
-
 United Kingdom
-
United States
-
 Uruguay
-
 Uzbekistan
-
 Venezuela
-
 Vietnam
-
 Yemen
Yemen
-
 Zambia
-
 Zimbabwe
- Forex
- Crypto











