
JetBlue Airways shares technical analysis: Weak momentum puts $5.15 support in focus

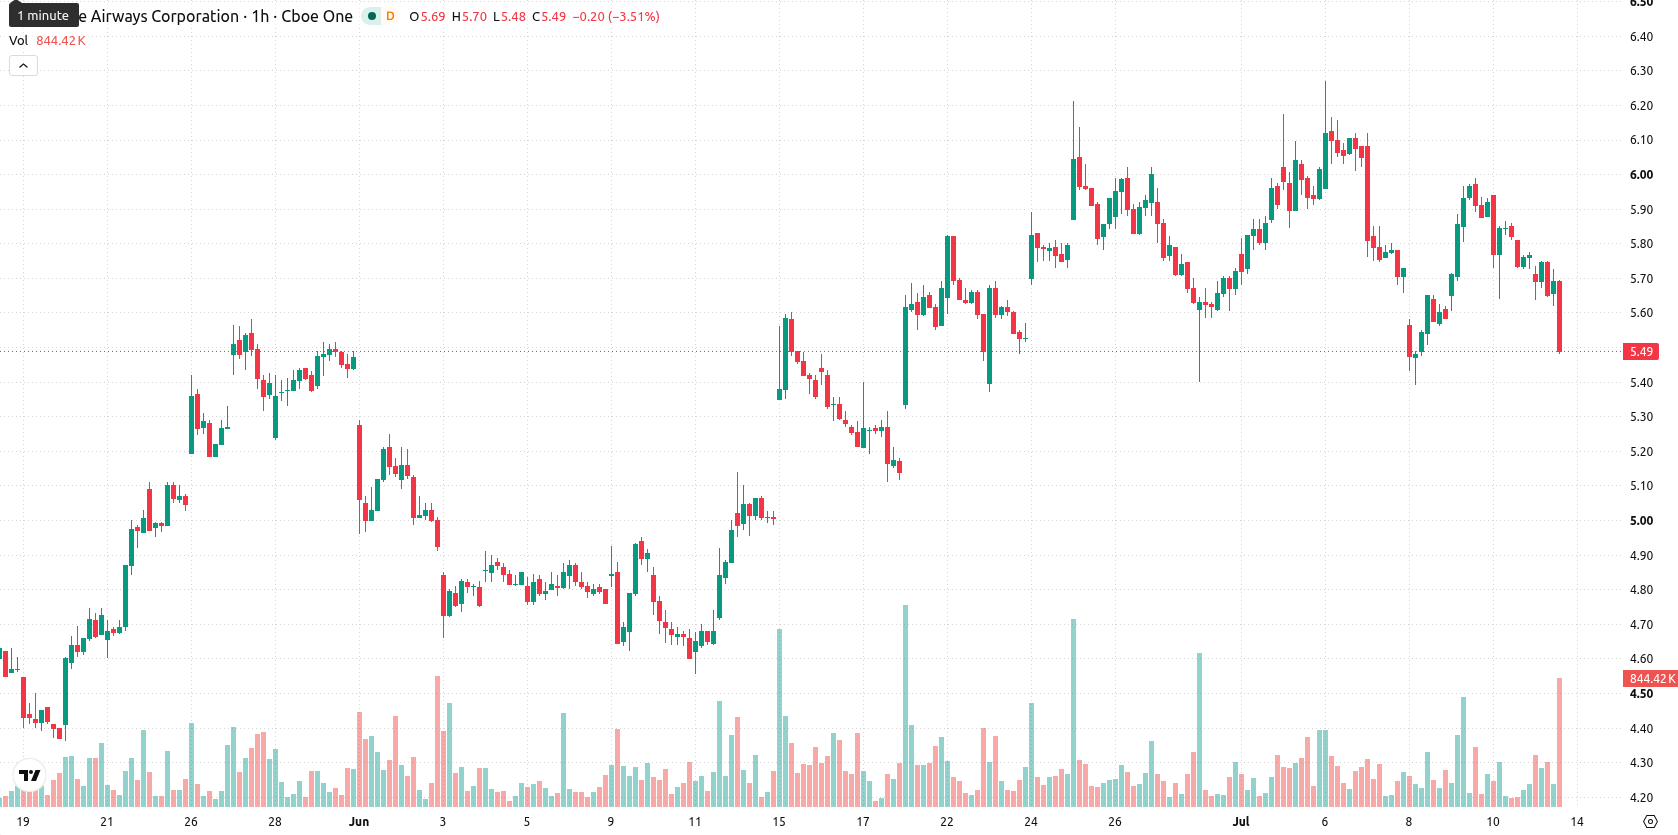
JetBlue Airways (JBLU) stock is trading at $5.49 after declining 4.69% on the day, closing near session lows. The price is currently positioned below its key short- and medium-term moving averages but remains above the longer-term trend support.
 5.61
6.00
5.61
6.00
Highlights
- JetBlue launched its largest schedule at Fort Lauderdale, adding eight new routes and planning further expansion this year.
- The airline introduced triple-daily nonstop flights between Fort Lauderdale and Nashville, targeting enhanced capacity on a high-volume corridor.
- JBLU faces strong short- and medium-term selling pressures with high volatility, likely to trade between $5.15 and $5.83, downside momentum favored.
Broader selling pressure persists despite network expansion and new routes
JetBlue expanded its network reach by launching its largest-ever flight schedule at Fort Lauderdale-Hollywood International Airport, introducing 8 new destinations and planning additional connections for later in the year, as reported by Aviationsourcenews. The airline also began triple-daily nonstop service between Fort Lauderdale and Nashville on July 9, 2026, increasing capacity on a high-traffic route, according to Nomadlawyer. Operational challenges were noted when JetBlue flight JBU413 from Boston to San Francisco diverted to Denver on July 12, 2026, as reported by Travelandtourworld, though price action has remained under broader selling pressure.
Negative momentum dominates as price hovers between key technical levels
On the hourly chart, JBLU is currently trading below the 20-period and 50-period moving averages, which are set at $5.79 and $5.83, respectively. However, the price remains above the daily 200-period moving average at $4.94, while the Ichimoku Kijun line at $5.69 serves as immediate resistance. Support is established at $5.15 and resistance at $5.83. Momentum indicators reflect a negative technical profile: the Relative Strength Index (RSI) stands at 44.97 (Sell), the Moving Average Convergence Divergence (MACD) gives a Sell signal, and the Average Directional Index (ADX) is Neutral, highlighting weak trend strength. The Stochastic RSI is in oversold territory and the Commodity Channel Index (CCI) remains in Sell territory, with Bull/Bear Power and the Awesome Oscillator both consistent with prevailing seller dominance.
Rangebound outlook favored as downside risk outweighs upside potential
In the short term, JBLU is expected to trade within a range of $5.15 to $5.83, reflecting its typical volatility band relative to current levels. Given the current technical and momentum backdrop, the probability of an upside breakout is very low, while the likelihood of a further downward move is high. The base case is for the stock to stabilize and move sideways within this range. Should bullish momentum develop and price exceed $5.69, an advance toward the upper end of the range is possible, whereas a breakdown below $5.15 could intensify downside momentum.
Earlier, analysts noted that JetBlue's strategy of expanding its route network particularly in Florida, aimed to offset ongoing selling pressure and position the airline for future growth. With current price action remaining weak despite operational milestones, traders should monitor for a decisive move above $5.69 or below $5.15 as a signal for the next directional trend.







-
 Afghanistan
-
 Albania
-
 Algeria
-
 Angola
-
 Argentina
-
 Armenia
-
 Australia
-
 Austria
-
 Azerbaijan
-
 Bahamas
-
 Bahrain
-
 Bangladesh
-
 Belarus
-
 Belgium
-
 Bolivia
-
 Botswana
-
 Brazil
-
 Brunei
-
 Bulgaria
-
 Cambodia
-
 Cameroon
-
 Canada
-
 Chile
Chile
-
 China
China
-
 Colombia
-
 Congo
Congo
-
 Costa Rica
-
 Cote d'Ivoire
-
 Croatia
-
 Cuba
Cuba
-
 Cyprus
-
 Czechia
-
 DR Congo
-
 Denmark
-
 Dominican Republic
-
 Ecuador
-
 Egypt
Egypt
-
 El Salvador
-
 Estonia
-
 Eswatini
-
 Ethiopia
-
 Finland
-
 France
-
 Georgia
-
 Germany
-
 Ghana
Ghana
-
 Greece
-
 Haiti
Haiti
-
 Hong Kong
-
 Hungary
-
 India
India
-
 Indonesia
-
 Iran, Islamic republic
-
 Iraq
Iraq
-
 Ireland
-
 Israel
-
 Italy
Italy
-
 Jamaica
-
 Japan
Japan
-
 Jordan
-
 Kazakhstan
-
 Kenya
Kenya
-
 Korea
Korea
-
 Kuwait
-
 Kyrgyzstan
-
 Laos
Laos
-
 Latvia
-
 Lebanon
-
 Lesotho
-
 Libya
Libya
-
 Lithuania
-
 Luxembourg
-
 Madagascar
-
 Malaysia
-
 Malta
Malta
-
 Mauritius
-
 Mexico
-
 Moldova
-
 Mongolia
-
 Montenegro
-
 Morocco
-
 Mozambique
-
 Myanmar
-
 Namibia
-
 Nepal
Nepal
-
 Netherlands
-
 New Zealand
-
 Nigeria
-
 North Macedonia
-
 Norway
-
 Oman
Oman
-
 Pakistan
-
 Palestine
-
 Panama
-
 Papua New Guinea
-
 Paraguay
-
 Peru
Peru
-
 Philippines
-
 Poland
-
 Portugal
-
 Puerto Rico
-
 Qatar
Qatar
-
 Reunion
-
 Romania
-
 Rwanda
-
 Saudi Arabia
-
 Serbia
-
 Singapore
-
 Slovakia
-
 Slovenia
-
 Somalia
-
 South Africa
-
 Spain
Spain
-
 Sri Lanka
-
 Sweden
-
 Switzerland
-
 Syria
Syria
-
 Taiwan
-
 Tajikistan
-
 Tanzania
-
 Thailand
-
 Trinidad and Tobago
-
 Tunisia
-
 Turkey
-
 UAE
UAE
-
 Uganda
-
 Ukraine
-
 United Kingdom
-
United States
-
 Uruguay
-
 Uzbekistan
-
 Venezuela
-
 Vietnam
-
 Yemen
Yemen
-
 Zambia
-
 Zimbabwe
- Forex
- Crypto











