
Qualcomm stock price prediction: Oversold conditions may limit further downside

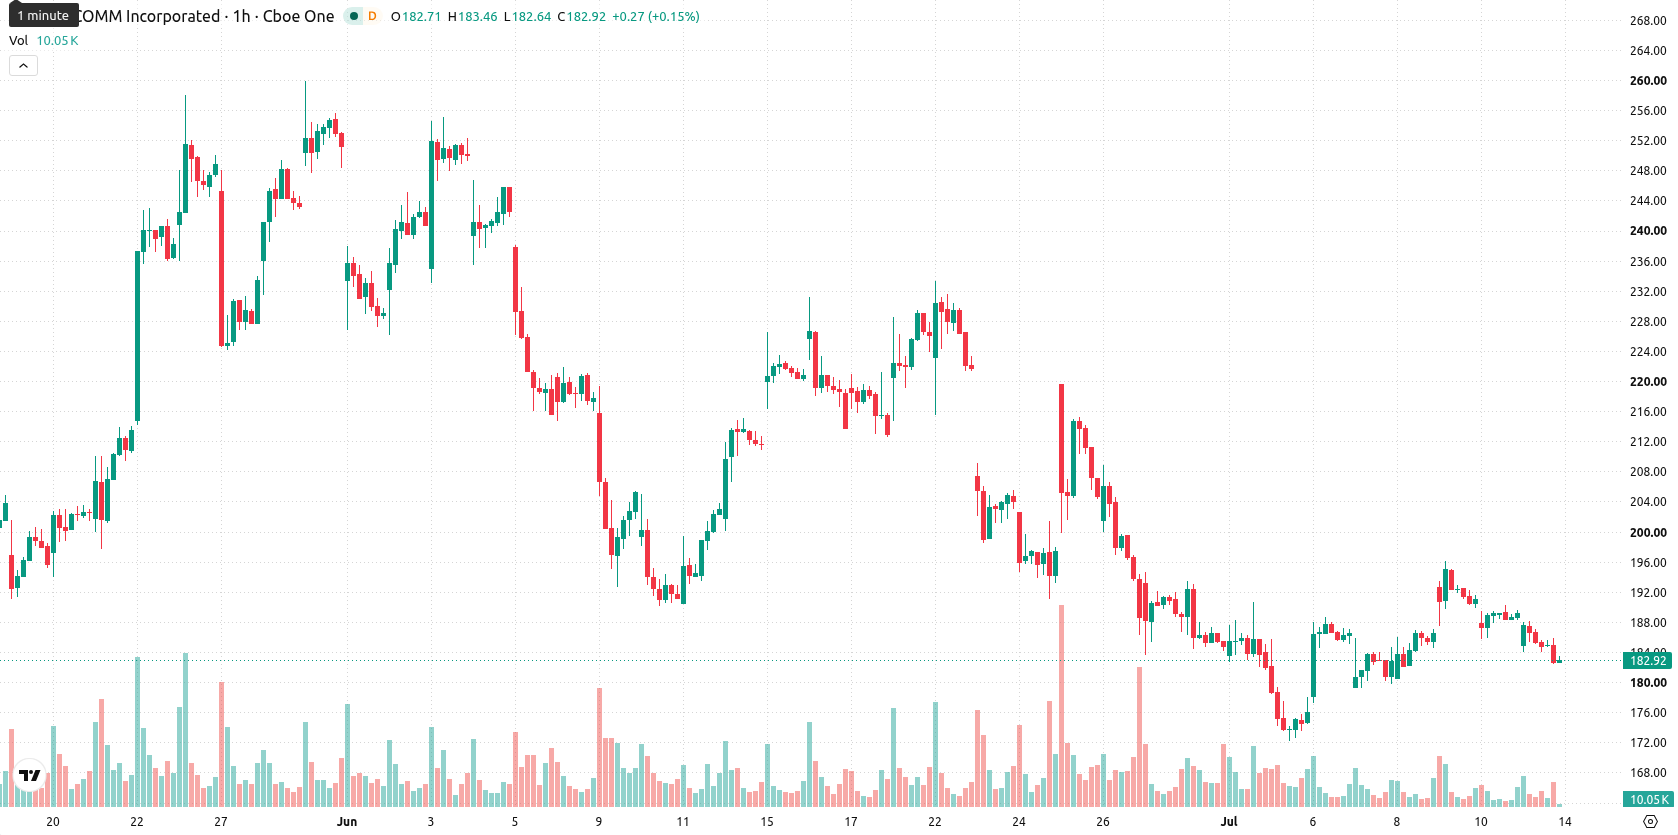
Qualcomm (QCOM) stock is trading at $182.39, marking a decline of 3.31% for the day. The stock currently sits below its key moving averages, reflecting broad intraday selling pressure.
 183.28
196.09
183.28
196.09
Highlights
- QCOM faces consistent seller pressure, trading below short- and medium-term moving averages and posting a 3.31% intraday drop to $182.39.
- Momentum indicators signal prevailing weakness, as oversold conditions and neutral oscillators suggest limited upside potential.
- Price is likely to fluctuate within a $174.75–$190.03 range over the next several days, with a 78% probability of further downside.
Seller dominance holds with resistance at Kijun and mixed momentum
On the hourly chart, QCOM is trading below both its 20-period and 50-period moving averages, while still remaining above the long-term 200-period moving average. Immediate resistance is defined by the Ichimoku Kijun level at $189.04, and support sits at the long-term MA-200. Across intraday indicators, the Relative Strength Index (RSI) reads 45.33 and signals a Sell condition, while both the Commodity Channel Index (CCI) and Bull/Bear Power flag oversold status with evident seller dominance. The Moving Average Convergence Divergence (MACD), Average Directional Index (ADX), Stochastic RSI, and the Awesome Oscillator all present neutral signals, highlighting mixed momentum and a divergence among oscillators.
Downside move favored as volatility range narrows
Looking ahead to the next several trading days, the projected range for QCOM is $174.75 to $190.03, reflecting a volatility band relative to current levels. The baseline scenario is for QCOM to trade sideways between these bounds. A bullish case would require the price to break above the $189.04 resistance and exit the upper end of the band, while a bearish scenario would see the price drop through support and approach the $174.75 level. Probabilities currently favor a downward move (78%) versus an upward breakout (22%).
Earlier, analysts noted that Qualcomm shares had displayed strong upward momentum, underpinned by strategic moves in AI and positive technical signals. The recent deterioration in technical conditions and a persistent bias toward further downside now highlight the importance of monitoring whether support near the long-term moving average can contain additional selling pressure.


Latest Qualcomm News






-
 Afghanistan
-
 Albania
-
 Algeria
-
 Angola
-
 Argentina
-
 Armenia
-
 Australia
-
 Austria
-
 Azerbaijan
-
 Bahamas
-
 Bahrain
-
 Bangladesh
-
 Belarus
-
 Belgium
-
 Bolivia
-
 Botswana
-
 Brazil
-
 Brunei
-
 Bulgaria
-
 Cambodia
-
 Cameroon
-
 Canada
-
 Chile
Chile
-
 China
China
-
 Colombia
-
 Congo
Congo
-
 Costa Rica
-
 Cote d'Ivoire
-
 Croatia
-
 Cuba
Cuba
-
 Cyprus
-
 Czechia
-
 DR Congo
-
 Denmark
-
 Dominican Republic
-
 Ecuador
-
 Egypt
Egypt
-
 El Salvador
-
 Estonia
-
 Eswatini
-
 Ethiopia
-
 Finland
-
 France
-
 Georgia
-
 Germany
-
 Ghana
Ghana
-
 Greece
-
 Haiti
Haiti
-
 Hong Kong
-
 Hungary
-
 India
India
-
 Indonesia
-
 Iran, Islamic republic
-
 Iraq
Iraq
-
 Ireland
-
 Israel
-
 Italy
Italy
-
 Jamaica
-
 Japan
Japan
-
 Jordan
-
 Kazakhstan
-
 Kenya
Kenya
-
 Korea
Korea
-
 Kuwait
-
 Kyrgyzstan
-
 Laos
Laos
-
 Latvia
-
 Lebanon
-
 Lesotho
-
 Libya
Libya
-
 Lithuania
-
 Luxembourg
-
 Madagascar
-
 Malaysia
-
 Malta
Malta
-
 Mauritius
-
 Mexico
-
 Moldova
-
 Mongolia
-
 Montenegro
-
 Morocco
-
 Mozambique
-
 Myanmar
-
 Namibia
-
 Nepal
Nepal
-
 Netherlands
-
 New Zealand
-
 Nigeria
-
 North Macedonia
-
 Norway
-
 Oman
Oman
-
 Pakistan
-
 Palestine
-
 Panama
-
 Papua New Guinea
-
 Paraguay
-
 Peru
Peru
-
 Philippines
-
 Poland
-
 Portugal
-
 Puerto Rico
-
 Qatar
Qatar
-
 Reunion
-
 Romania
-
 Rwanda
-
 Saudi Arabia
-
 Serbia
-
 Singapore
-
 Slovakia
-
 Slovenia
-
 Somalia
-
 South Africa
-
 Spain
Spain
-
 Sri Lanka
-
 Sweden
-
 Switzerland
-
 Syria
Syria
-
 Taiwan
-
 Tajikistan
-
 Tanzania
-
 Thailand
-
 Trinidad and Tobago
-
 Tunisia
-
 Turkey
-
 UAE
UAE
-
 Uganda
-
 Ukraine
-
 United Kingdom
-
United States
-
 Uruguay
-
 Uzbekistan
-
 Venezuela
-
 Vietnam
-
 Yemen
Yemen
-
 Zambia
-
 Zimbabwe
- Forex
- Crypto











