
Stable regulated revenue model supports distributions. Can NG stock regain momentum?

National Grid (NG) stock is trading at GBX1,241.50 with a modest gain on the day, moving slightly higher. The price remains above its key moving averages, suggesting ongoing support from multiple timeframes.
 1250.50
1253.00
1250.50
1253.00
Highlights
- National Grid's significant infrastructure investment signals a drive to enhance long-term assets and future earnings potential.
- The company’s regulated revenue framework supports stable cash flow and has historically enabled consistent shareholder distributions, appealing to income investors.
- Technicals reflect an overall bullish structure with price holding above key supports, though overbought signals suggest near-term consolidation within the GBX1,229–GBX1,253 range.
Infrastructure investment plan boosts appeal amid stable cash flow model
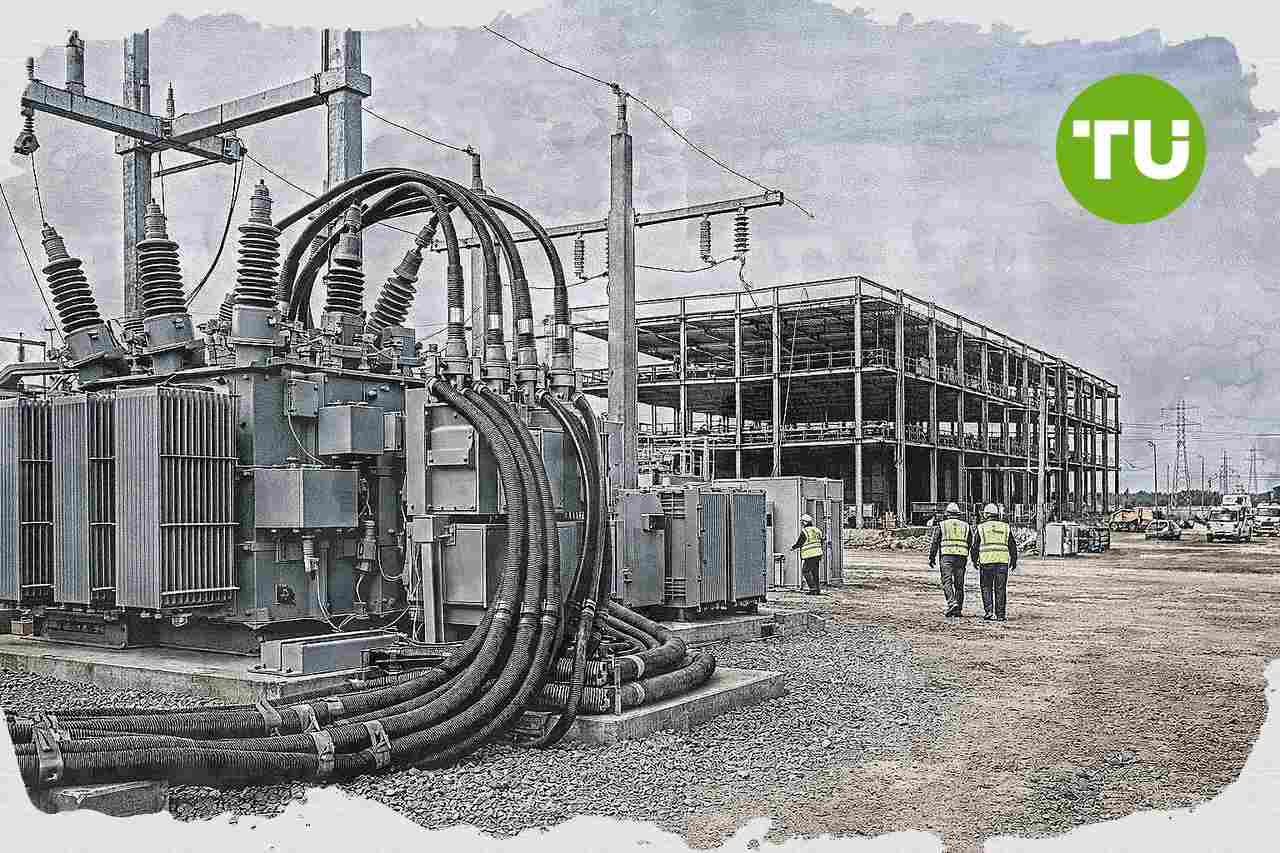
National Grid has unveiled a major investment plan, which demonstrates the company's ongoing commitment to enhancing its infrastructure and may raise expectations for future earnings potential. This move draws attention to National Grid's regulated revenue model, a structure that, according to Kalkinemedia, provides relatively stable cash flows and has underpinned a strong record of shareholder distributions. Such factors appeal to income-oriented investors, supporting broader demand for NG shares despite ongoing questions about the sustainability of future dividend payouts.
Divergent momentum signals as overbought conditions clash with neutral trend
On the hourly chart, NG trades above the MA-20 at GBX1,233 and the MA-50 at GBX1,236, while also staying above the MA-200 at GBX1,220 on the daily timeframe. The Ichimoku Kijun on the daily chart sets support at GBX1,234. Momentum readings remain mixed: Moving Average Convergence Divergence (MACD) and Average Directional Index (ADX) are neutral, while the Relative Strength Index (RSI) stands just above 53, favoring buyers. However, Stochastic RSI signals a strong sell, and both the Commodity Channel Index (CCI) and Bull/Bear Power reflect overbought intraday conditions, with the Awesome Oscillator neutral. This constellation points to diverging signals, where overbought pressure is evident but broader trend momentum is lacking.
Tight trading range likely as breakout risks shape directional outlook
Over the next several sessions, the anticipated price range for NG is GBX1,229 to GBX1,253, reflecting a typical volatility band relative to current levels. The probability of an upward move is calculated at 78%, with downside risk estimated at 22%. Price action is expected to fluctuate within a sideways corridor; a confirmed break above resistance may shift momentum toward the bullish scenario, while movement below current support would imply the activation of a bearish case.
Earlier, analysts noted that supportive regulatory frameworks and predictable infrastructure investments have historically provided stability and appeal for income-oriented utility stocks. With National Grid now unveiling a major investment plan and technicals suggesting diverging short-term signals, traders should monitor the potential for a volatility-driven breakout beyond current ranges as a key indicator of the next directional move.


Latest National Grid News





-
 Afghanistan
-
 Albania
-
 Algeria
-
 Angola
-
 Argentina
-
 Armenia
-
 Australia
-
 Austria
-
 Azerbaijan
-
 Bahamas
-
 Bahrain
-
 Bangladesh
-
 Belarus
-
 Belgium
-
 Bolivia
-
 Botswana
-
 Brazil
-
 Brunei
-
 Bulgaria
-
 Cambodia
-
 Cameroon
-
 Canada
-
 Chile
Chile
-
 China
China
-
 Colombia
-
 Congo
Congo
-
 Costa Rica
-
 Cote d'Ivoire
-
 Croatia
-
 Cuba
Cuba
-
 Cyprus
-
 Czechia
-
 DR Congo
-
 Denmark
-
 Dominican Republic
-
 Ecuador
-
 Egypt
Egypt
-
 El Salvador
-
 Estonia
-
 Eswatini
-
 Ethiopia
-
 Finland
-
 France
-
 Georgia
-
 Germany
-
 Ghana
Ghana
-
 Greece
-
 Haiti
Haiti
-
 Hong Kong
-
 Hungary
-
 India
India
-
 Indonesia
-
 Iran, Islamic republic
-
 Iraq
Iraq
-
 Ireland
-
 Israel
-
 Italy
Italy
-
 Jamaica
-
 Japan
Japan
-
 Jordan
-
 Kazakhstan
-
 Kenya
Kenya
-
 Korea
Korea
-
 Kuwait
-
 Kyrgyzstan
-
 Laos
Laos
-
 Latvia
-
 Lebanon
-
 Lesotho
-
 Libya
Libya
-
 Lithuania
-
 Luxembourg
-
 Madagascar
-
 Malaysia
-
 Malta
Malta
-
 Mauritius
-
 Mexico
-
 Moldova
-
 Mongolia
-
 Montenegro
-
 Morocco
-
 Mozambique
-
 Myanmar
-
 Namibia
-
 Nepal
Nepal
-
 Netherlands
-
 New Zealand
-
 Nigeria
-
 North Macedonia
-
 Norway
-
 Oman
Oman
-
 Pakistan
-
 Palestine
-
 Panama
-
 Papua New Guinea
-
 Paraguay
-
 Peru
Peru
-
 Philippines
-
 Poland
-
 Portugal
-
 Puerto Rico
-
 Qatar
Qatar
-
 Reunion
-
 Romania
-
 Rwanda
-
 Saudi Arabia
-
 Serbia
-
 Singapore
-
 Slovakia
-
 Slovenia
-
 Somalia
-
 South Africa
-
 Spain
Spain
-
 Sri Lanka
-
 Sweden
-
 Switzerland
-
 Syria
Syria
-
 Taiwan
-
 Tajikistan
-
 Tanzania
-
 Thailand
-
 Trinidad and Tobago
-
 Tunisia
-
 Turkey
-
 UAE
UAE
-
 Uganda
-
 Ukraine
-
 United Kingdom
-
United States
-
 Uruguay
-
 Uzbekistan
-
 Venezuela
-
 Vietnam
-
 Yemen
Yemen
-
 Zambia
-
 Zimbabwe
- Forex
- Crypto











