

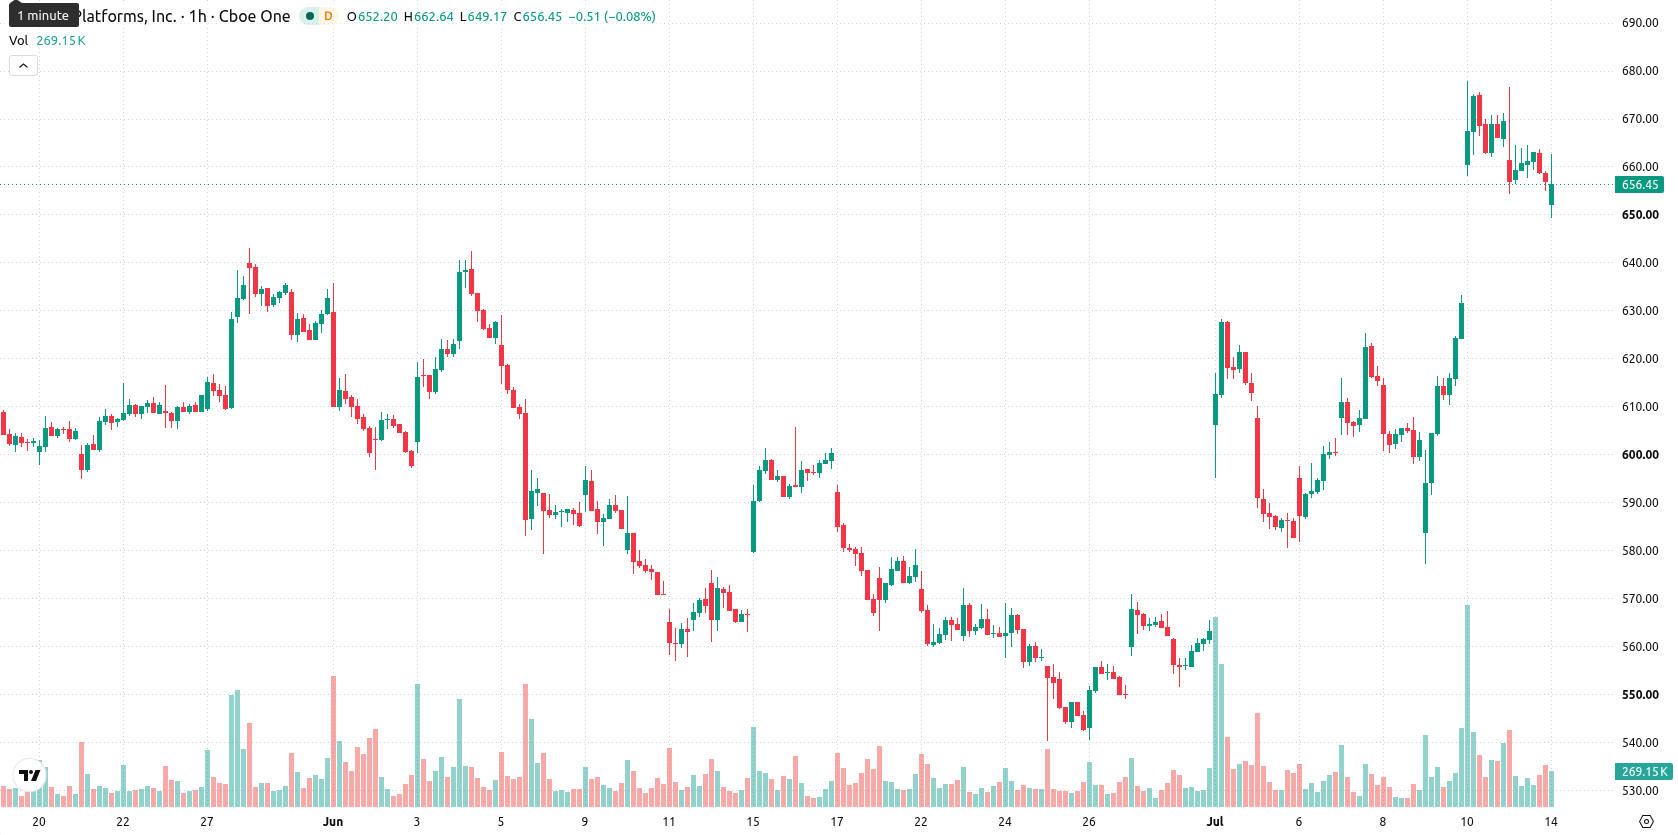
Meta (META) stock is trading at $656.22, marking a daily decline of 1.92% and closing near session lows. The current price remains above its key moving averages, signaling continued underlying momentum despite the pullback.
 664.26
675.30
664.26
675.30
Highlights
- Meta is committing over $50 billion to expand its Hyperion data center in Louisiana to 5 gigawatts for AI infrastructure.
- A 20-year state sales tax exemption and $1 billion in local infrastructure investment improve project return and strengthen Meta's regional presence.
- META/USD shows strong bullish momentum with a 73% probability of remaining within the $612.29 to $700.15 trading range in the near term.
Aggressive infrastructure push as strategic spending meets persistent selling
Meta expanded its Hyperion data center project in Richland Parish, Louisiana, to a planned 5 gigawatts of compute capacity, committing over $50 billion to significantly increase its U.S. AI infrastructure, according to CNBC. The financial impact of this capital outlay is being partially reduced through a 20-year sales tax exemption offered by the state for data centers established before 2029, as reported by Tomshardware, improving the project's overall return profile. Additionally, Meta intends to invest more than $1 billion in local Louisiana infrastructure improvements tied to the Hyperion expansion, further entrenching its operational base in the region. Despite these substantial strategic investments, price action has remained under broader selling pressure.
Conflicting signals as key supports hold and momentum oscillators diverge
Technically, META is holding above the 20-day moving average at $649.8, the 50-day at $619.45, and the long-term 200-day moving average at $642.2. Immediate support is established at the Ichimoku Kijun level of $627.47. Momentum indicators present a mixed picture: the Moving Average Convergence Divergence (MACD) signals Strong Buy, the Average Directional Index (ADX) also supports a Buy stance, while the Relative Strength Index (RSI) sits at 59.85, indicating mild bullishness. Meanwhile, the Stochastic RSI is oversold, the Commodity Channel Index (CCI) is neutral, Bull/Bear Power reads overbought, and the Awesome Oscillator is neutral, reflecting short-term divergence between momentum and intraday oscillators.
Sideways movement favored as volatility band tightens risk outlook
In the short term, META is expected to trade within the $612.29 to $700.15 volatility band relative to current levels. The scenario with the highest probability, at 73%, sees the stock moving sideways within this range. A bullish breakout could emerge if resistance is surpassed, while a close below immediate support at $627.47 would suggest increased risk for a downward move, though this scenario remains less likely at present.
Earlier, analysts noted that Meta’s sustained technical momentum and aggressive investment in AI infrastructure were driving a bullish outlook for the stock. With the stock now displaying resilience above major moving averages despite recent selling pressure, close attention should be paid to whether META can maintain support at $627.47, as a sustained break below this level could prompt additional downside risk.









-
 Afghanistan
-
 Albania
-
 Algeria
-
 Angola
-
 Argentina
-
 Armenia
-
 Australia
-
 Austria
-
 Azerbaijan
-
 Bahamas
-
 Bahrain
-
 Bangladesh
-
 Belarus
-
 Belgium
-
 Bolivia
-
 Botswana
-
 Brazil
-
 Brunei
-
 Bulgaria
-
 Cambodia
-
 Cameroon
-
 Canada
-
 Chile
Chile
-
 China
China
-
 Colombia
-
 Congo
Congo
-
 Costa Rica
-
 Cote d'Ivoire
-
 Croatia
-
 Cuba
Cuba
-
 Cyprus
-
 Czechia
-
 DR Congo
-
 Denmark
-
 Dominican Republic
-
 Ecuador
-
 Egypt
Egypt
-
 El Salvador
-
 Estonia
-
 Eswatini
-
 Ethiopia
-
 Finland
-
 France
-
 Georgia
-
 Germany
-
 Ghana
Ghana
-
 Greece
-
 Haiti
Haiti
-
 Hong Kong
-
 Hungary
-
 India
India
-
 Indonesia
-
 Iran, Islamic republic
-
 Iraq
Iraq
-
 Ireland
-
 Israel
-
 Italy
Italy
-
 Jamaica
-
 Japan
Japan
-
 Jordan
-
 Kazakhstan
-
 Kenya
Kenya
-
 Korea
Korea
-
 Kuwait
-
 Kyrgyzstan
-
 Laos
Laos
-
 Latvia
-
 Lebanon
-
 Lesotho
-
 Libya
Libya
-
 Lithuania
-
 Luxembourg
-
 Madagascar
-
 Malaysia
-
 Malta
Malta
-
 Mauritius
-
 Mexico
-
 Moldova
-
 Mongolia
-
 Montenegro
-
 Morocco
-
 Mozambique
-
 Myanmar
-
 Namibia
-
 Nepal
Nepal
-
 Netherlands
-
 New Zealand
-
 Nigeria
-
 North Macedonia
-
 Norway
-
 Oman
Oman
-
 Pakistan
-
 Palestine
-
 Panama
-
 Papua New Guinea
-
 Paraguay
-
 Peru
Peru
-
 Philippines
-
 Poland
-
 Portugal
-
 Puerto Rico
-
 Qatar
Qatar
-
 Reunion
-
 Romania
-
 Rwanda
-
 Saudi Arabia
-
 Serbia
-
 Singapore
-
 Slovakia
-
 Slovenia
-
 Somalia
-
 South Africa
-
 Spain
Spain
-
 Sri Lanka
-
 Sweden
-
 Switzerland
-
 Syria
Syria
-
 Taiwan
-
 Tajikistan
-
 Tanzania
-
 Thailand
-
 Trinidad and Tobago
-
 Tunisia
-
 Turkey
-
 UAE
UAE
-
 Uganda
-
 Ukraine
-
 United Kingdom
-
United States
-
 Uruguay
-
 Uzbekistan
-
 Venezuela
-
 Vietnam
-
 Yemen
Yemen
-
 Zambia
-
 Zimbabwe
- Forex
- Crypto











