
Can Alphabet stock hold $319.40 support as sellers dominate the trend?

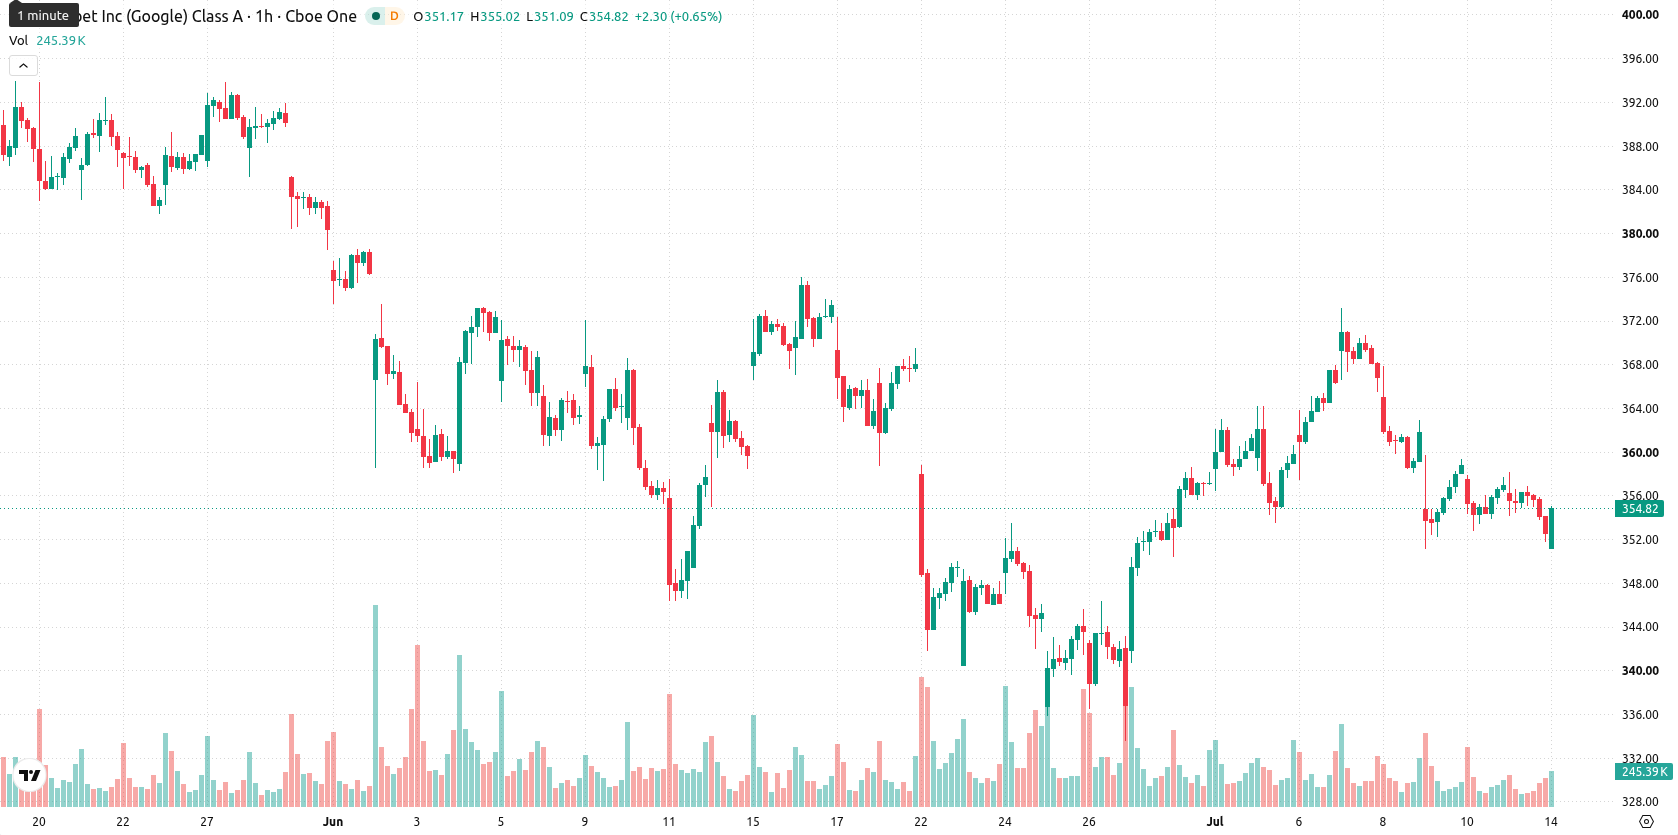
Alphabet (GOOGL) stock is trading at $352.56, registering a daily decline of 1.31%. The price remains below its key moving averages, indicating short- and medium-term weakness for the session.
 358.62
367.84
358.62
367.84
Highlights
- Alphabet posted a notable profit increase driven by strong AI investments that improved operational efficiency and margins.
- The company raised its quarterly dividend to $0.22 per share, paid June 15, 2026, as search traffic grew 4% in June.
- GOOGL trades below key short- and medium-term averages with momentum indicators oversold, and a 77% chance of further downside within a $342.69–$362.43 range.
Profit surge and AI integration strengthen outlook amid persistent selling
Alphabet reported a significant profit surge resulting from substantial investments in artificial intelligence, which boosted operational efficiency and margins, as noted by Cryptobriefing. This improved performance reflects both robust earnings and successful integration of AI into core business lines, enhancing the company's long-term growth outlook. In addition, Alphabet raised its quarterly dividend to $0.22 per share, paid on June 15, 2026, and continued to see solid user engagement with a 4% increase in search traffic for June — though price action has remained under broader selling pressure.
Oversold signals build as technical resistance caps further downside
GOOGL is currently positioned below both the MA-20 at $355.58 and MA-50 at $359.95, suggesting technical resistance at these levels, while remaining above the MA-200 at $319.4, which acts as long-term support. The nearest resistance is marked by the Ichimoku Kijun at $356.99. The Moving Average Convergence Divergence (MACD) shows a sell setup, and the Average Directional Index (ADX) indicates neutral trend strength. The Relative Strength Index (RSI) registers at 36.6, and both Stochastic RSI and Commodity Channel Index (CCI) are positioned in oversold territory. Bull/Bear Power highlights prevailing selling pressure, while the Awesome Oscillator shows a neutral stance, and price action today was characterized by a negative gap and moderate volatility. The presence of a cluster of oversold signals against persistent downward momentum highlights a divergence, with sellers dominating but signs of exhaustion appearing.
Downside breakout risk elevated as volatility narrows trading range
In the next two to three trading sessions, GOOGL is expected to fluctuate between $342.69 and $362.43, capturing typical volatility relative to current levels. The probability favors a downside breakout, estimated at 77%, while only a 23% chance is assigned to an upward rebound. If GOOGL holds within the defined range, baseline consolidation is likely. A move above resistance could trigger a short-term recovery, whereas a break below support may accelerate further losses.
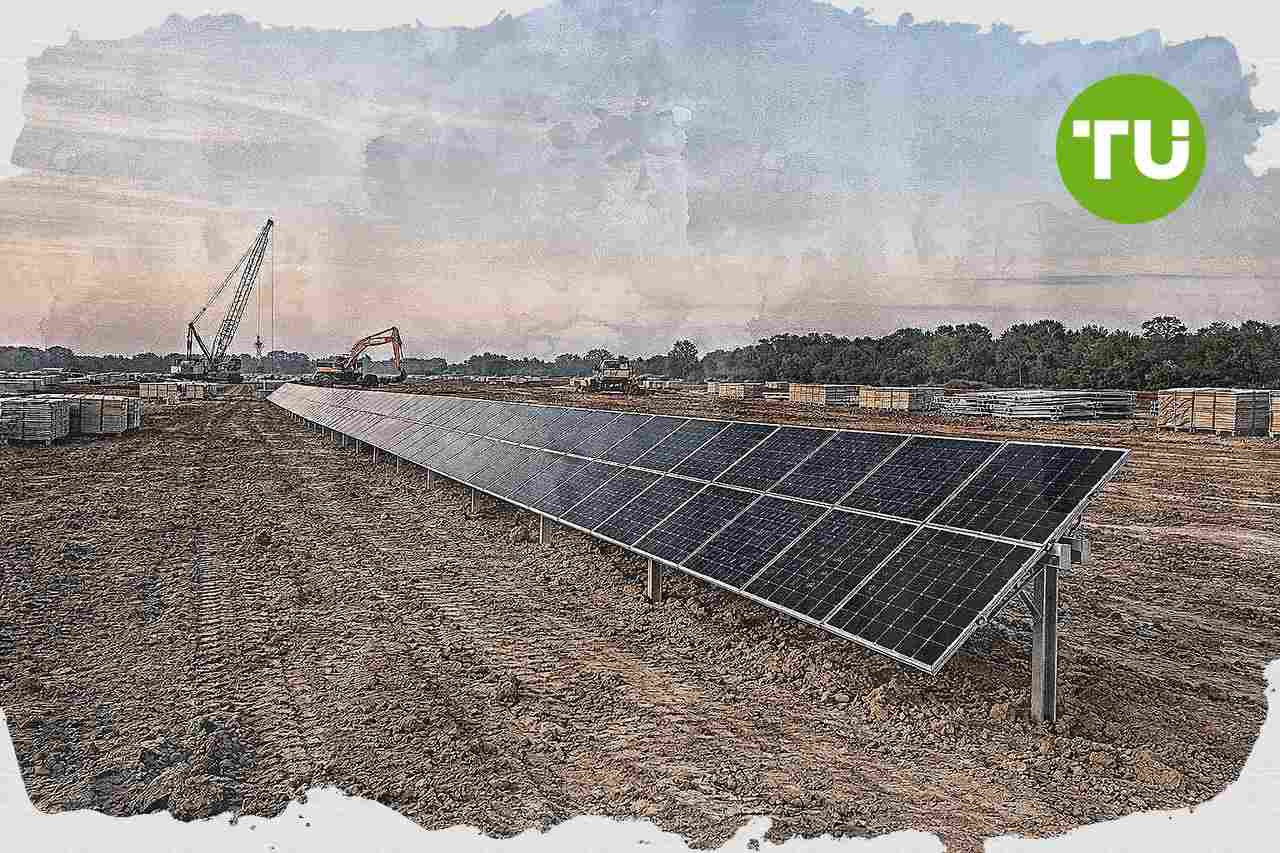
Previously it was reported that Alphabet had deepened its commitment to clean energy through a major solar power purchase agreement, aligning with broader strategic efforts to manage the company’s growing energy demands. With current technical signals showing persistent selling pressure and oversold momentum, traders should closely monitor for a potential downside breakout or accelerated volatility in the coming sessions.








-
 Afghanistan
-
 Albania
-
 Algeria
-
 Angola
-
 Argentina
-
 Armenia
-
 Australia
-
 Austria
-
 Azerbaijan
-
 Bahamas
-
 Bahrain
-
 Bangladesh
-
 Belarus
-
 Belgium
-
 Bolivia
-
 Botswana
-
 Brazil
-
 Brunei
-
 Bulgaria
-
 Cambodia
-
 Cameroon
-
 Canada
-
 Chile
Chile
-
 China
China
-
 Colombia
-
 Congo
Congo
-
 Costa Rica
-
 Cote d'Ivoire
-
 Croatia
-
 Cuba
Cuba
-
 Cyprus
-
 Czechia
-
 DR Congo
-
 Denmark
-
 Dominican Republic
-
 Ecuador
-
 Egypt
Egypt
-
 El Salvador
-
 Estonia
-
 Eswatini
-
 Ethiopia
-
 Finland
-
 France
-
 Georgia
-
 Germany
-
 Ghana
Ghana
-
 Greece
-
 Haiti
Haiti
-
 Hong Kong
-
 Hungary
-
 India
India
-
 Indonesia
-
 Iran, Islamic republic
-
 Iraq
Iraq
-
 Ireland
-
 Israel
-
 Italy
Italy
-
 Jamaica
-
 Japan
Japan
-
 Jordan
-
 Kazakhstan
-
 Kenya
Kenya
-
 Korea
Korea
-
 Kuwait
-
 Kyrgyzstan
-
 Laos
Laos
-
 Latvia
-
 Lebanon
-
 Lesotho
-
 Libya
Libya
-
 Lithuania
-
 Luxembourg
-
 Madagascar
-
 Malaysia
-
 Malta
Malta
-
 Mauritius
-
 Mexico
-
 Moldova
-
 Mongolia
-
 Montenegro
-
 Morocco
-
 Mozambique
-
 Myanmar
-
 Namibia
-
 Nepal
Nepal
-
 Netherlands
-
 New Zealand
-
 Nigeria
-
 North Macedonia
-
 Norway
-
 Oman
Oman
-
 Pakistan
-
 Palestine
-
 Panama
-
 Papua New Guinea
-
 Paraguay
-
 Peru
Peru
-
 Philippines
-
 Poland
-
 Portugal
-
 Puerto Rico
-
 Qatar
Qatar
-
 Reunion
-
 Romania
-
 Rwanda
-
 Saudi Arabia
-
 Serbia
-
 Singapore
-
 Slovakia
-
 Slovenia
-
 Somalia
-
 South Africa
-
 Spain
Spain
-
 Sri Lanka
-
 Sweden
-
 Switzerland
-
 Syria
Syria
-
 Taiwan
-
 Tajikistan
-
 Tanzania
-
 Thailand
-
 Trinidad and Tobago
-
 Tunisia
-
 Turkey
-
 UAE
UAE
-
 Uganda
-
 Ukraine
-
 United Kingdom
-
United States
-
 Uruguay
-
 Uzbekistan
-
 Venezuela
-
 Vietnam
-
 Yemen
Yemen
-
 Zambia
-
 Zimbabwe
- Forex
- Crypto











