
Why is Adobe stock falling today? Selloff intensifies inside $213.47–$234.37 range

Adobe Inc. (ADBE) stock is trading at $221.94, down 3.71% on the day and near its session lows amid moderate volatility. The price is positioned below its key short- and medium-term moving averages, highlighting ongoing pressure within the prevailing trend.
 224.11
232.04
224.11
232.04
Highlights
- Adobe shares remain under broad selling pressure, with a 36.5% one-year and 34.1% year-to-date decline reflecting prolonged negative sentiment.
- Short-term rebounds saw the stock gain 5.8% over the past week and 13.0% in the last month, signaling intermittent buyer appetite amid overall weakness.
- Technicals indicate $213.47–$234.37 as the likely trading range next 2–3 days, with high upside probability but momentum divergence suggesting potential consolidation.
Recent recovery clashes with prolonged selling as sentiment shifts
Adobe Inc. faced a significant one-year share price drop of 36.5% and a year-to-date decline of 34.1%, underscoring persistent negative sentiment among investors. However, the shares recorded gains of 5.8% over the past week and 13.0% in the last month, according to Gurufocus, reflecting intermittent periods of buying interest as market participants responded to shifting business sentiment. The mixed pattern of recent recovery alongside prolonged weakness continues to frame the background for current trading, though price action has remained under broader selling pressure.
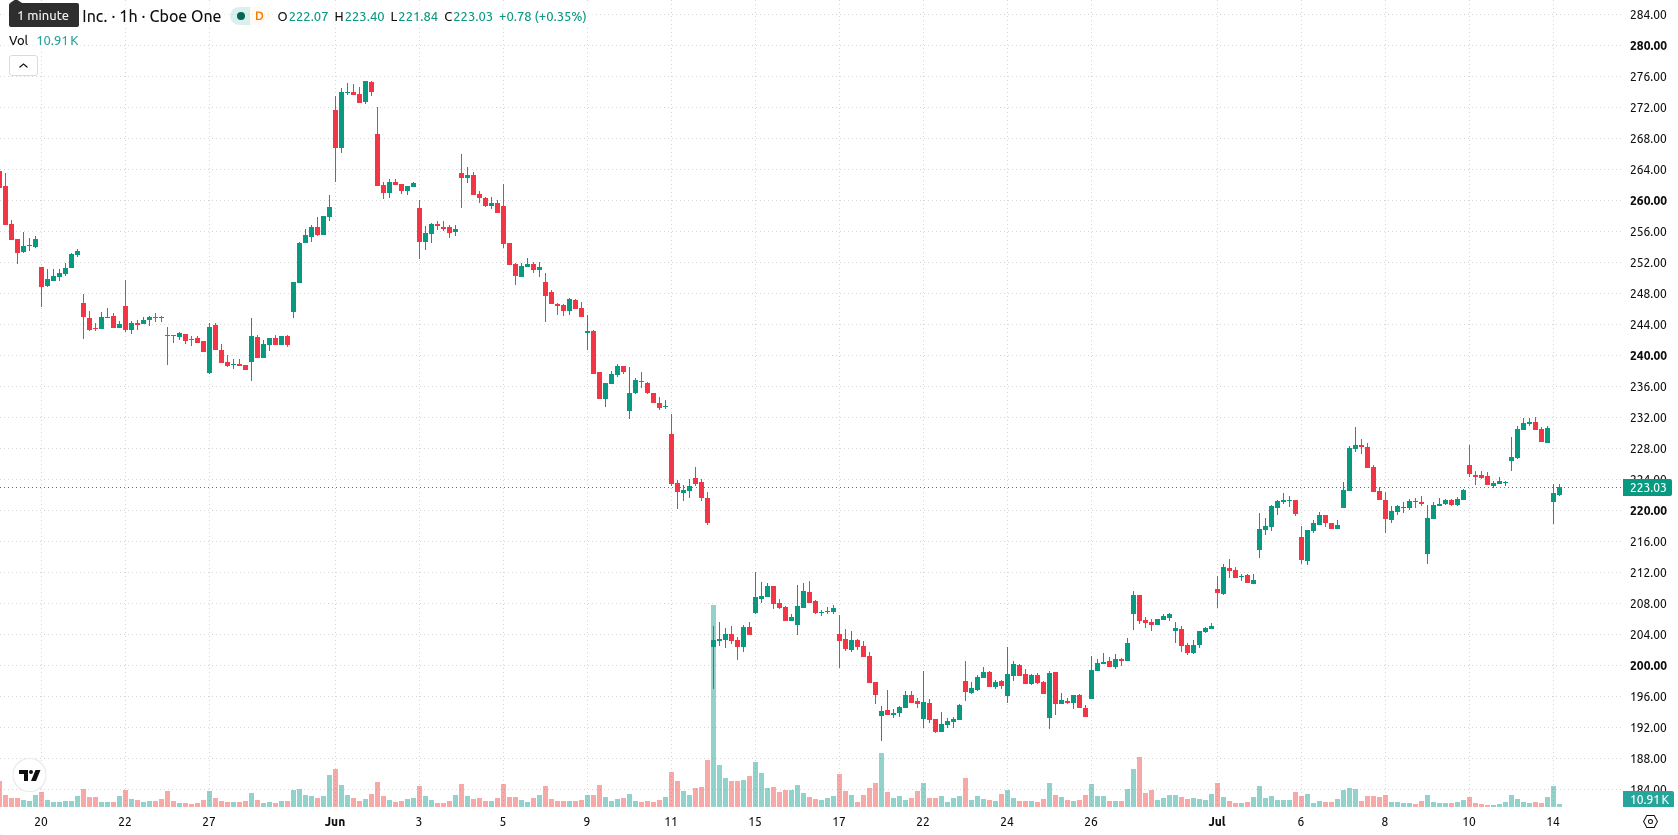
Conflicting momentum signals amid resistance tests and sharp drop
On the technical front, ADBE is trading below the 20-period moving average ($225.24) and the 50-period moving average ($222.48) on the H1 timeframe, and stays well beneath the 200-period moving average ($284.48) on the daily chart. The Ichimoku Kijun level at $222.59 acts as immediate resistance. On the H1 chart, the Moving Average Convergence Divergence (MACD), Average Directional Index (ADX), and Commodity Channel Index (CCI) all point to bullish momentum, while the Relative Strength Index (RSI) signals 67.74 (Buy) and the Bull/Bear Power indicator shows overbought conditions. However, the Stochastic RSI and Awesome Oscillator are both neutral, signaling some caution as not all oscillators confirm the intraday bullish move. This contrasts with the price's sharp daily drop and gap down, suggesting possible short-term exhaustion or divergence within a context of moderate volatility.
Upside favored as volatility defines near-term consolidation range
Looking ahead to the next 2–3 trading sessions, ADBE is expected to trade within a range of $213.47 to $234.37, based on recent volatility. The probability of an upside move is very high, while a downside extension is considered very unlikely. The central scenario calls for price consolidation within this defined range. A break above immediate resistance at the Ichimoku Kijun could lead to a test of the upper range, while a decisive drop below the lower bound would confirm further downside momentum.
Earlier, analysts noted that Adobe exhibited short-term bullish momentum supported by strong earnings and share repurchase plans, though caution was advised due to overbought technical conditions and prevailing long-term weakness. The current setup introduces a new layer of volatility and diverging intraday signals, making close attention to the immediate resistance at $222.59 and the potential for consolidation within the $213.47–$234.37 range essential for traders navigating the next sessions.







-
 Afghanistan
-
 Albania
-
 Algeria
-
 Angola
-
 Argentina
-
 Armenia
-
 Australia
-
 Austria
-
 Azerbaijan
-
 Bahamas
-
 Bahrain
-
 Bangladesh
-
 Belarus
-
 Belgium
-
 Bolivia
-
 Botswana
-
 Brazil
-
 Brunei
-
 Bulgaria
-
 Cambodia
-
 Cameroon
-
 Canada
-
 Chile
Chile
-
 China
China
-
 Colombia
-
 Congo
Congo
-
 Costa Rica
-
 Cote d'Ivoire
-
 Croatia
-
 Cuba
Cuba
-
 Cyprus
-
 Czechia
-
 DR Congo
-
 Denmark
-
 Dominican Republic
-
 Ecuador
-
 Egypt
Egypt
-
 El Salvador
-
 Estonia
-
 Eswatini
-
 Ethiopia
-
 Finland
-
 France
-
 Georgia
-
 Germany
-
 Ghana
Ghana
-
 Greece
-
 Haiti
Haiti
-
 Hong Kong
-
 Hungary
-
 India
India
-
 Indonesia
-
 Iran, Islamic republic
-
 Iraq
Iraq
-
 Ireland
-
 Israel
-
 Italy
Italy
-
 Jamaica
-
 Japan
Japan
-
 Jordan
-
 Kazakhstan
-
 Kenya
Kenya
-
 Korea
Korea
-
 Kuwait
-
 Kyrgyzstan
-
 Laos
Laos
-
 Latvia
-
 Lebanon
-
 Lesotho
-
 Libya
Libya
-
 Lithuania
-
 Luxembourg
-
 Madagascar
-
 Malaysia
-
 Malta
Malta
-
 Mauritius
-
 Mexico
-
 Moldova
-
 Mongolia
-
 Montenegro
-
 Morocco
-
 Mozambique
-
 Myanmar
-
 Namibia
-
 Nepal
Nepal
-
 Netherlands
-
 New Zealand
-
 Nigeria
-
 North Macedonia
-
 Norway
-
 Oman
Oman
-
 Pakistan
-
 Palestine
-
 Panama
-
 Papua New Guinea
-
 Paraguay
-
 Peru
Peru
-
 Philippines
-
 Poland
-
 Portugal
-
 Puerto Rico
-
 Qatar
Qatar
-
 Reunion
-
 Romania
-
 Rwanda
-
 Saudi Arabia
-
 Serbia
-
 Singapore
-
 Slovakia
-
 Slovenia
-
 Somalia
-
 South Africa
-
 Spain
Spain
-
 Sri Lanka
-
 Sweden
-
 Switzerland
-
 Syria
Syria
-
 Taiwan
-
 Tajikistan
-
 Tanzania
-
 Thailand
-
 Trinidad and Tobago
-
 Tunisia
-
 Turkey
-
 UAE
UAE
-
 Uganda
-
 Ukraine
-
 United Kingdom
-
United States
-
 Uruguay
-
 Uzbekistan
-
 Venezuela
-
 Vietnam
-
 Yemen
Yemen
-
 Zambia
-
 Zimbabwe
- Forex
- Crypto











