
Texas Instruments stock forecast: Modest bullish bias after recent pullback

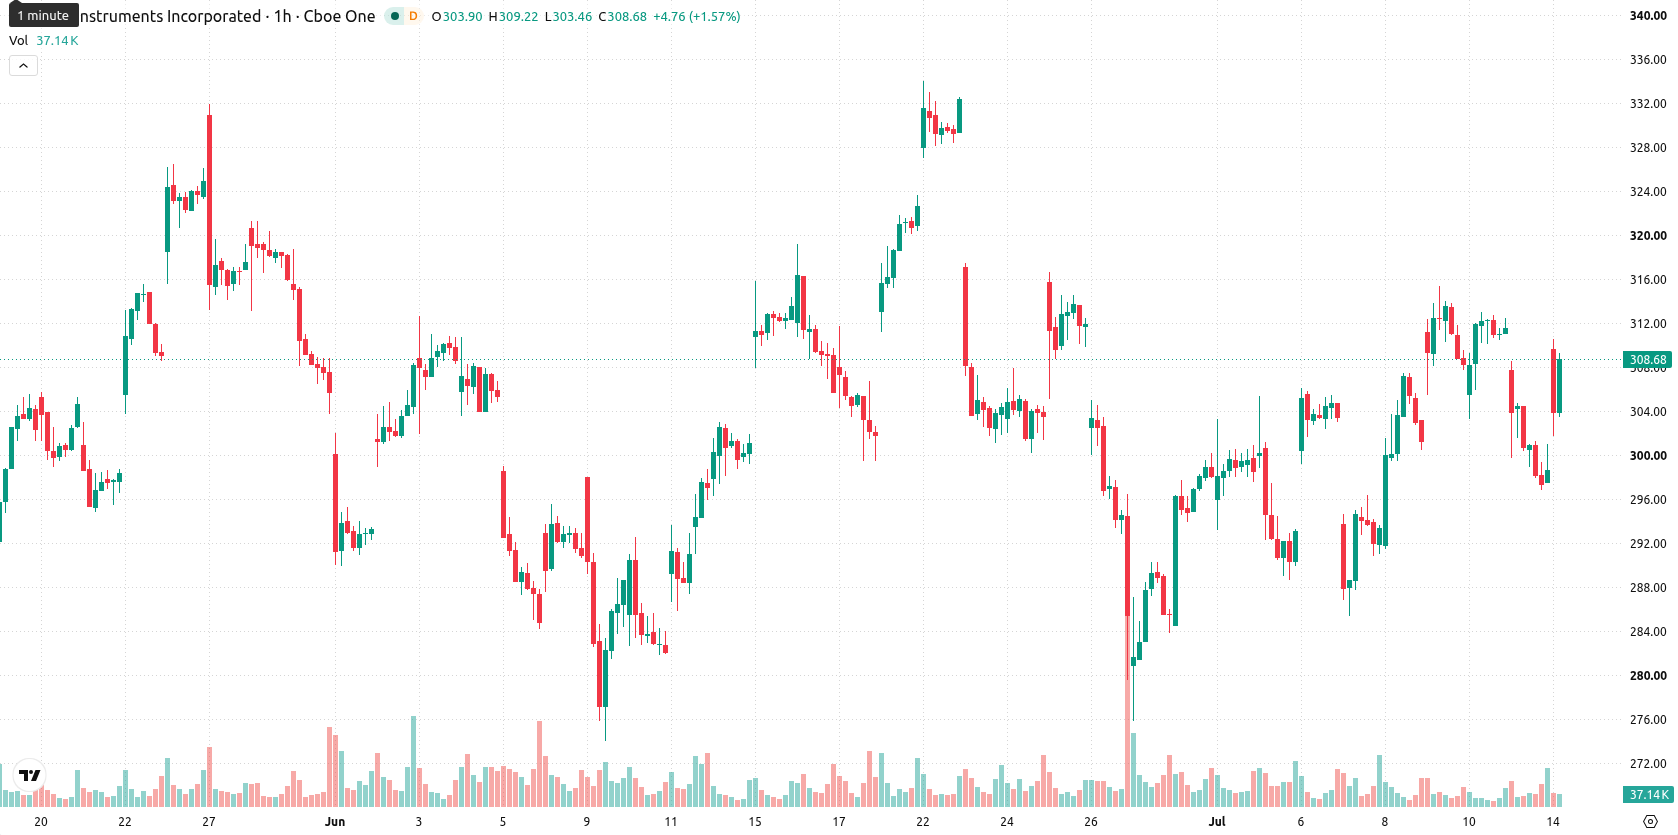
Texas Instruments (TXN) stock is trading at $307.96 after climbing 3.14% on the day. The stock is positioned above its key moving averages, reflecting continued short- and medium-term strength.
 289.10
312.01
289.10
312.01
Highlights
- Texas Instruments shares declined following persistently weak demand in industrial and automotive markets, resulting in high inventories and pressured sales momentum.
- Elevated capital expenditures are restraining free cash flow and reducing Texas Instruments' short-term financial flexibility while macro headwinds worsen sentiment.
- Technically, TXN trades near daily highs with dominant short-term buying, expected to consolidate between $295.73 and $320.19 over the next few days.
Industrial weakness and capital constraints weigh on investor sentiment
Recent news highlights that, on July 13, Texas Instruments experienced a drop in share value due to ongoing weak demand in industrial and automotive segments, leading to prolonged inventory levels and reduced sales momentum, according to Tradingkey. Elevated capital expenditures continue to constrain the company's free cash flow, limiting near-term financial flexibility. In addition, persistent inflation and high interest rates are suppressing sector capital spending, collectively impacting market sentiment toward Texas Instruments.
Neutral momentum and overbought signals amid strong support levels
On the hourly chart, TXN is trading above the MA-20 at $306.58 and the MA-50 at $302.26, while on the daily timeframe it remains well above the MA-200 at $219.18. The Ichimoku Kijun level at $306.08 marks an immediate support area just below the current price. Among momentum indicators, the Moving Average Convergence Divergence (MACD) signals a Sell, the Average Directional Index (ADX) is Neutral, and the Relative Strength Index (RSI) stands at 50.37, indicating a modest bullish bias. Other indicators, such as Stochastic RSI, Commodity Channel Index (CCI), and Awesome Oscillator, remain Neutral, while Bull/Bear Power is Overbought, pointing to short-term buyer dominance.
Consolidation expected unless volatility bands are breached
Given the current setup, the typical volatility band for the next 2–3 trading days is expected between $295.73 and $320.19. There is a 78% probability for TXN to move higher, while the likelihood of a decline sits at 22%. The baseline scenario is for price consolidation within this corridor, with a bullish extension possible if the price breaks above $320.19 or fresh selling pressure triggered if support at $295.73 is breached.
Earlier, analysts noted that persistent shifts in consumer preferences and macroeconomic pressure were weighing on major companies' operating performance and investor sentiment. Now, with Texas Instruments facing ongoing headwinds from weak end-market demand and constrained free cash flow, traders should closely monitor the $320.19 resistance, as a breakout above this level could signal renewed upside momentum.


Latest Texas Instruments News







-
 Afghanistan
-
 Albania
-
 Algeria
-
 Angola
-
 Argentina
-
 Armenia
-
 Australia
-
 Austria
-
 Azerbaijan
-
 Bahamas
-
 Bahrain
-
 Bangladesh
-
 Belarus
-
 Belgium
-
 Bolivia
-
 Botswana
-
 Brazil
-
 Brunei
-
 Bulgaria
-
 Cambodia
-
 Cameroon
-
 Canada
-
 Chile
Chile
-
 China
China
-
 Colombia
-
 Congo
Congo
-
 Costa Rica
-
 Cote d'Ivoire
-
 Croatia
-
 Cuba
Cuba
-
 Cyprus
-
 Czechia
-
 DR Congo
-
 Denmark
-
 Dominican Republic
-
 Ecuador
-
 Egypt
Egypt
-
 El Salvador
-
 Estonia
-
 Eswatini
-
 Ethiopia
-
 Finland
-
 France
-
 Georgia
-
 Germany
-
 Ghana
Ghana
-
 Greece
-
 Haiti
Haiti
-
 Hong Kong
-
 Hungary
-
 India
India
-
 Indonesia
-
 Iran, Islamic republic
-
 Iraq
Iraq
-
 Ireland
-
 Israel
-
 Italy
Italy
-
 Jamaica
-
 Japan
Japan
-
 Jordan
-
 Kazakhstan
-
 Kenya
Kenya
-
 Korea
Korea
-
 Kuwait
-
 Kyrgyzstan
-
 Laos
Laos
-
 Latvia
-
 Lebanon
-
 Lesotho
-
 Libya
Libya
-
 Lithuania
-
 Luxembourg
-
 Madagascar
-
 Malaysia
-
 Malta
Malta
-
 Mauritius
-
 Mexico
-
 Moldova
-
 Mongolia
-
 Montenegro
-
 Morocco
-
 Mozambique
-
 Myanmar
-
 Namibia
-
 Nepal
Nepal
-
 Netherlands
-
 New Zealand
-
 Nigeria
-
 North Macedonia
-
 Norway
-
 Oman
Oman
-
 Pakistan
-
 Palestine
-
 Panama
-
 Papua New Guinea
-
 Paraguay
-
 Peru
Peru
-
 Philippines
-
 Poland
-
 Portugal
-
 Puerto Rico
-
 Qatar
Qatar
-
 Reunion
-
 Romania
-
 Rwanda
-
 Saudi Arabia
-
 Serbia
-
 Singapore
-
 Slovakia
-
 Slovenia
-
 Somalia
-
 South Africa
-
 Spain
Spain
-
 Sri Lanka
-
 Sweden
-
 Switzerland
-
 Syria
Syria
-
 Taiwan
-
 Tajikistan
-
 Tanzania
-
 Thailand
-
 Trinidad and Tobago
-
 Tunisia
-
 Turkey
-
 UAE
UAE
-
 Uganda
-
 Ukraine
-
 United Kingdom
-
United States
-
 Uruguay
-
 Uzbekistan
-
 Venezuela
-
 Vietnam
-
 Yemen
Yemen
-
 Zambia
-
 Zimbabwe
- Forex
- Crypto











