
Will Texas Instruments stock hold support as seller pressure weighs?

Texas Instruments (TXN) stock is trading at $282.21 after closing the most recent session down 3.08%. The stock currently sits below its short- and medium-term moving averages, but remains above its long-term level.
 289.10
312.01
289.10
312.01
Highlights
- Texas Instruments declared a quarterly dividend of $1.42 per share for August 2026, underscoring stable capital returns to shareholders.
- Despite stable distributions, TXN's share price remains under sustained selling pressure amid a challenging environment for equities.
- Technical signals indicate strong bearish momentum with TXN expected to trade between $271.79 and $292.63, downside risk prevailing barring a break above immediate resistance.
Dividend announcement supports stability as selling pressure persists
Texas Instruments' board of directors declared a quarterly cash dividend of $1.42 per share, scheduled for payment on August 11, 2026 to shareholders of record as of July 31, 2026, according to Prnewswire. This confirmed dividend signals the company's continued focus on returning capital to investors, reinforcing stability in shareholder distributions. While the dividend supports ongoing liquidity for shareholders, price action has remained under broader selling pressure.
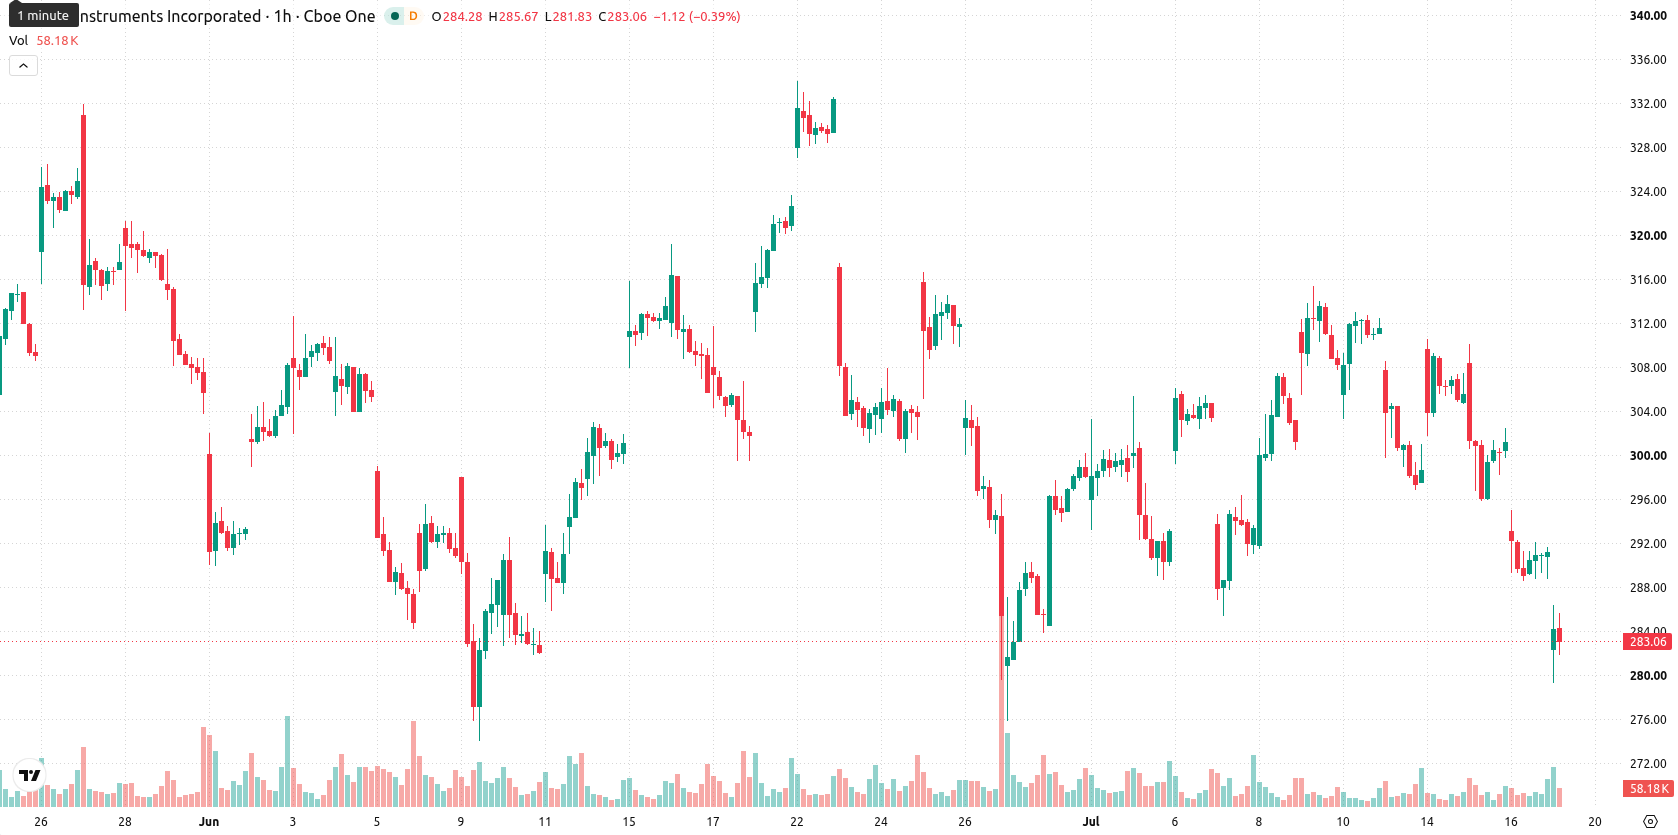
Bearish momentum prevails as technicals show negative alignment
Technical levels for TXN show the current price at $282.21 positioned below both the 20-period ($296.38) and 50-period ($302.5) moving averages, but still above the 200-period long-term average at $220.92 on the daily chart. Immediate resistance is marked by the Ichimoku Kijun at $297.25, while support is anchored near the recent lows. Momentum indicators are broadly negative: the Moving Average Convergence Divergence (MACD) signals a Sell, the Average Directional Index (ADX) shows neutral trend strength, and both the Relative Strength Index (RSI) and Stochastic RSI register in oversold territory. The Commodity Channel Index (CCI) and Bull/Bear Power also indicate a seller-dominated environment and the Awesome Oscillator corroborates ongoing bearish momentum. TXN closed near the session low amid moderate volatility, with all intraday oscillators aligning with the downside bias.
Downside scenario favored as resistance caps rebound potential
Over the next few sessions, TXN is expected to trade within a typical volatility band defined by $271.79 on the downside and $292.63 as the upper bound. The probability of an upward move is currently 23%, while further downside risk stands at 77%. A sideways scenario would prevail if the price remains within this channel. A clear bullish case would require a sustained breakout above immediate resistance, while renewed weakness below support would reinforce the bearish scenario.
Earlier, analysts noted that even robust performance and capital return plans from major chipmakers like Texas Instruments have not been enough to fully offset sector-wide volatility driven by elevated expectations and macroeconomic uncertainty. The current technical setup for TXN underscores the importance of the $271.79 support level, where a decisive breakdown could accelerate downside risk despite ongoing dividend stability.


Latest Texas Instruments News







-
 Afghanistan
-
 Albania
-
 Algeria
-
 Angola
-
 Argentina
-
 Armenia
-
 Australia
-
 Austria
-
 Azerbaijan
-
 Bahamas
-
 Bahrain
-
 Bangladesh
-
 Belarus
-
 Belgium
-
 Bolivia
-
 Botswana
-
 Brazil
-
 Brunei
-
 Bulgaria
-
 Cambodia
-
 Cameroon
-
 Canada
-
 Chile
Chile
-
 China
China
-
 Colombia
-
 Congo
Congo
-
 Costa Rica
-
 Cote d'Ivoire
-
 Croatia
-
 Cuba
Cuba
-
 Cyprus
-
 Czechia
-
 DR Congo
-
 Denmark
-
 Dominican Republic
-
 Ecuador
-
 Egypt
Egypt
-
 El Salvador
-
 Estonia
-
 Eswatini
-
 Ethiopia
-
 Finland
-
 France
-
 Georgia
-
 Germany
-
 Ghana
Ghana
-
 Greece
-
 Haiti
Haiti
-
 Hong Kong
-
 Hungary
-
 India
India
-
 Indonesia
-
 Iran, Islamic republic
-
 Iraq
Iraq
-
 Ireland
-
 Israel
-
 Italy
Italy
-
 Jamaica
-
 Japan
Japan
-
 Jordan
-
 Kazakhstan
-
 Kenya
Kenya
-
 Korea
Korea
-
 Kuwait
-
 Kyrgyzstan
-
 Laos
Laos
-
 Latvia
-
 Lebanon
-
 Lesotho
-
 Libya
Libya
-
 Lithuania
-
 Luxembourg
-
 Madagascar
-
 Malaysia
-
 Malta
Malta
-
 Mauritius
-
 Mexico
-
 Moldova
-
 Mongolia
-
 Montenegro
-
 Morocco
-
 Mozambique
-
 Myanmar
-
 Namibia
-
 Nepal
Nepal
-
 Netherlands
-
 New Zealand
-
 Nigeria
-
 North Macedonia
-
 Norway
-
 Oman
Oman
-
 Pakistan
-
 Palestine
-
 Panama
-
 Papua New Guinea
-
 Paraguay
-
 Peru
Peru
-
 Philippines
-
 Poland
-
 Portugal
-
 Puerto Rico
-
 Qatar
Qatar
-
 Reunion
-
 Romania
-
 Rwanda
-
 Saudi Arabia
-
 Serbia
-
 Singapore
-
 Slovakia
-
 Slovenia
-
 Somalia
-
 South Africa
-
 Spain
Spain
-
 Sri Lanka
-
 Sweden
-
 Switzerland
-
 Syria
Syria
-
 Taiwan
-
 Tajikistan
-
 Tanzania
-
 Thailand
-
 Trinidad and Tobago
-
 Tunisia
-
 Turkey
-
 UAE
UAE
-
 Uganda
-
 Ukraine
-
 United Kingdom
-
United States
-
 Uruguay
-
 Uzbekistan
-
 Venezuela
-
 Vietnam
-
 Yemen
Yemen
-
 Zambia
-
 Zimbabwe
- Forex
- Crypto











