
AST SpaceMobile stock outlook: Weak momentum keeps sellers in control.

AST SpaceMobile (ASTS) stock is trading at $66.31, down 3.65% on the day. The price sits below its key moving averages, indicating ongoing downward momentum.
 70.20
75.53
70.20
75.53
Highlights
- AST SpaceMobile plans to raise $1.0 billion via convertible senior notes due 2034, increasing leverage and potential shareholder dilution.
- The company delayed its direct-to-phone satellite launch to 2027 due to Blue Origin's launch failure, intensifying short-term revenue uncertainty.
- ASTS/USD faces strong bearish momentum, trades below key moving averages, and is expected to remain within a $61.44 to $71.18 range barring a breakout.
Funding drive and project delays prompt financial structure concerns
AST SpaceMobile has announced a proposed private offering of $1.0 billion of convertible senior notes due 2034 to support growth efforts, including expanding launch capacity, forging potential partnerships, and pursuing acquisitions to secure further orbital access, according to Businesswire. This pending capital raise introduces higher leverage and probable dilution for existing shareholders, prompting the market to reassess the company’s financial structure. Additionally, the company has postponed the launch of its direct-to-phone satellite service to 2027 following a Blue Origin launch failure and diminished launch opportunities, heightening uncertainty around near-term revenue prospects as reported by Theverge.
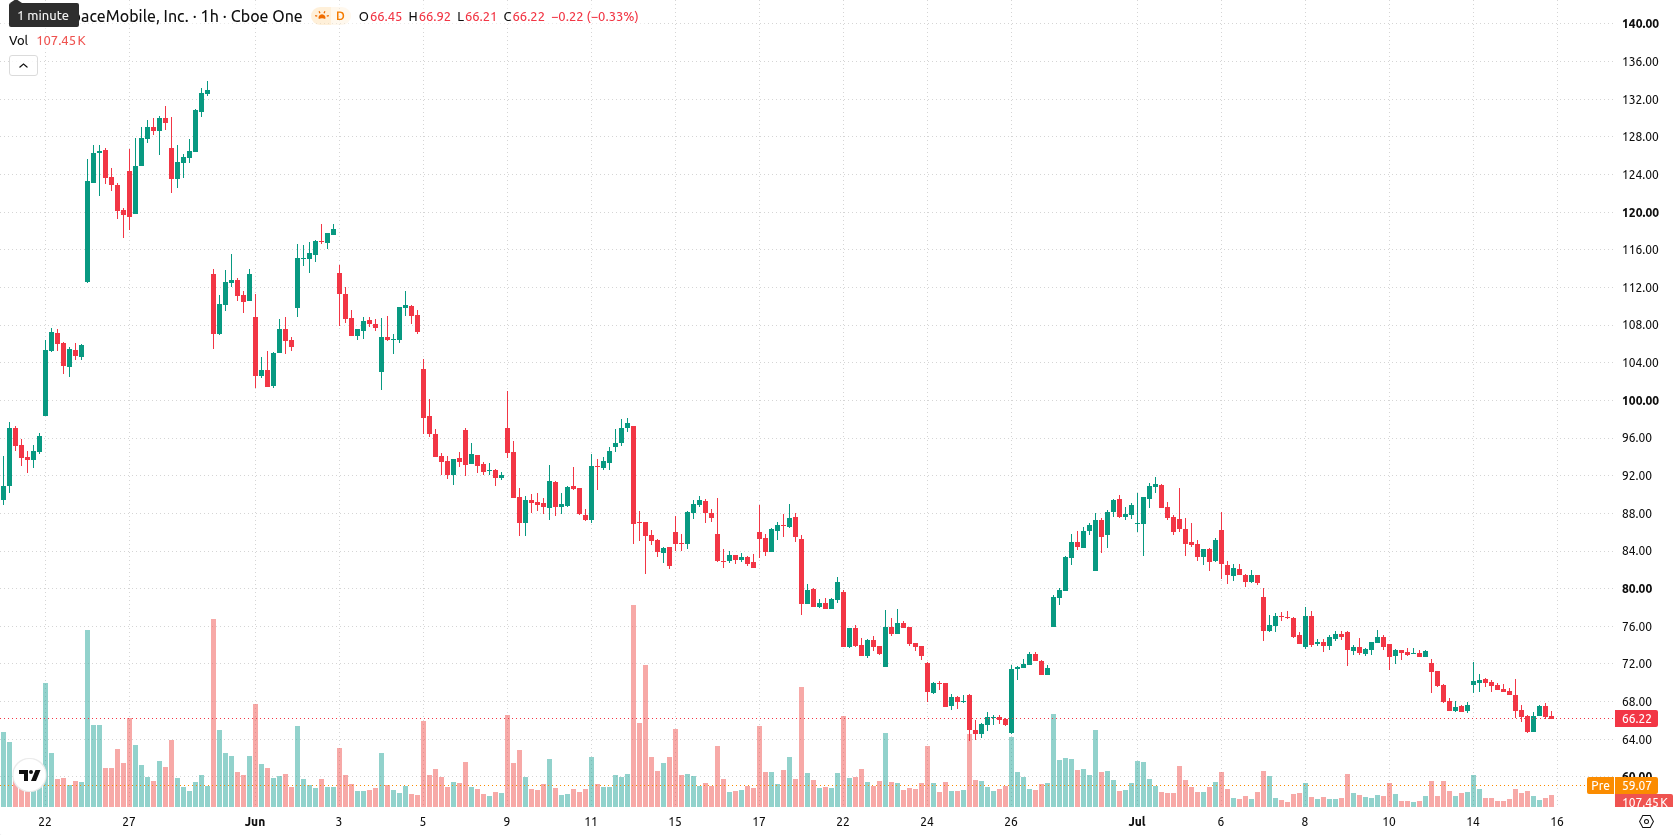
Momentum remains weak as multiple indicators confirm seller control
On the technical front, ASTS is trading below its 20-period ($68.03) and 50-period ($71.94) moving averages on the hourly chart, as well as the 200-period ($83.15) moving average on the daily timeframe. The Ichimoku Kijun line at $69.2 acts as immediate resistance for any upward moves. Relative Strength Index (RSI) stands at 33.48, nearing oversold territory, and Commodity Channel Index (CCI) also signals a sell. Moving Average Convergence Divergence (MACD) and Average Directional Index (ADX) remain firmly on sell, indicating sustained downward momentum. The Bull/Bear Power indicator is oversold, showing intraday seller dominance, while the Stochastic RSI and Awesome Oscillator both present neutral readings, suggesting mixed signals in short-term exhaustion and broader trend reinforcement.
Bearish scenario dominates amid low breakout odds and defined support
Looking ahead to the short term, ASTS is expected to trade within a range of $61.44 to $71.18 based on current volatility. The probability of an upward move is considered very low, with further declines highly likely unless consolidation holds in the present corridor. A scenario for renewed bullish momentum would require a decisive breakout above the $69.2 resistance. Conversely, if the price slips below the $61.44 support, it could trigger a further extension of the downtrend.
Earlier, analysts noted that despite operational progress, AST SpaceMobile remained under sustained seller pressure with a prevailing bearish structure. The latest developments—highlighted by increased financial leverage and launch delays—add further downside risk, making the $61.44 support a critical level to monitor for potential continuation of the current downtrend.


Latest AST SpaceMobile News





-
 Afghanistan
-
 Albania
-
 Algeria
-
 Angola
-
 Argentina
-
 Armenia
-
 Australia
-
 Austria
-
 Azerbaijan
-
 Bahamas
-
 Bahrain
-
 Bangladesh
-
 Belarus
-
 Belgium
-
 Bolivia
-
 Botswana
-
 Brazil
-
 Brunei
-
 Bulgaria
-
 Cambodia
-
 Cameroon
-
 Canada
-
 Chile
Chile
-
 China
China
-
 Colombia
-
 Congo
Congo
-
 Costa Rica
-
 Cote d'Ivoire
-
 Croatia
-
 Cuba
Cuba
-
 Cyprus
-
 Czechia
-
 DR Congo
-
 Denmark
-
 Dominican Republic
-
 Ecuador
-
 Egypt
Egypt
-
 El Salvador
-
 Estonia
-
 Eswatini
-
 Ethiopia
-
 Finland
-
 France
-
 Georgia
-
 Germany
-
 Ghana
Ghana
-
 Greece
-
 Haiti
Haiti
-
 Hong Kong
-
 Hungary
-
 India
India
-
 Indonesia
-
 Iran, Islamic republic
-
 Iraq
Iraq
-
 Ireland
-
 Israel
-
 Italy
Italy
-
 Jamaica
-
 Japan
Japan
-
 Jordan
-
 Kazakhstan
-
 Kenya
Kenya
-
 Korea
Korea
-
 Kuwait
-
 Kyrgyzstan
-
 Laos
Laos
-
 Latvia
-
 Lebanon
-
 Lesotho
-
 Libya
Libya
-
 Lithuania
-
 Luxembourg
-
 Madagascar
-
 Malaysia
-
 Malta
Malta
-
 Mauritius
-
 Mexico
-
 Moldova
-
 Mongolia
-
 Montenegro
-
 Morocco
-
 Mozambique
-
 Myanmar
-
 Namibia
-
 Nepal
Nepal
-
 Netherlands
-
 New Zealand
-
 Nigeria
-
 North Macedonia
-
 Norway
-
 Oman
Oman
-
 Pakistan
-
 Palestine
-
 Panama
-
 Papua New Guinea
-
 Paraguay
-
 Peru
Peru
-
 Philippines
-
 Poland
-
 Portugal
-
 Puerto Rico
-
 Qatar
Qatar
-
 Reunion
-
 Romania
-
 Rwanda
-
 Saudi Arabia
-
 Serbia
-
 Singapore
-
 Slovakia
-
 Slovenia
-
 Somalia
-
 South Africa
-
 Spain
Spain
-
 Sri Lanka
-
 Sweden
-
 Switzerland
-
 Syria
Syria
-
 Taiwan
-
 Tajikistan
-
 Tanzania
-
 Thailand
-
 Trinidad and Tobago
-
 Tunisia
-
 Turkey
-
 UAE
UAE
-
 Uganda
-
 Ukraine
-
 United Kingdom
-
United States
-
 Uruguay
-
 Uzbekistan
-
 Venezuela
-
 Vietnam
-
 Yemen
Yemen
-
 Zambia
-
 Zimbabwe
- Forex
- Crypto











