
Interactive Brokers stock forecast: Reversal setup emerges as price tests $74.73 support

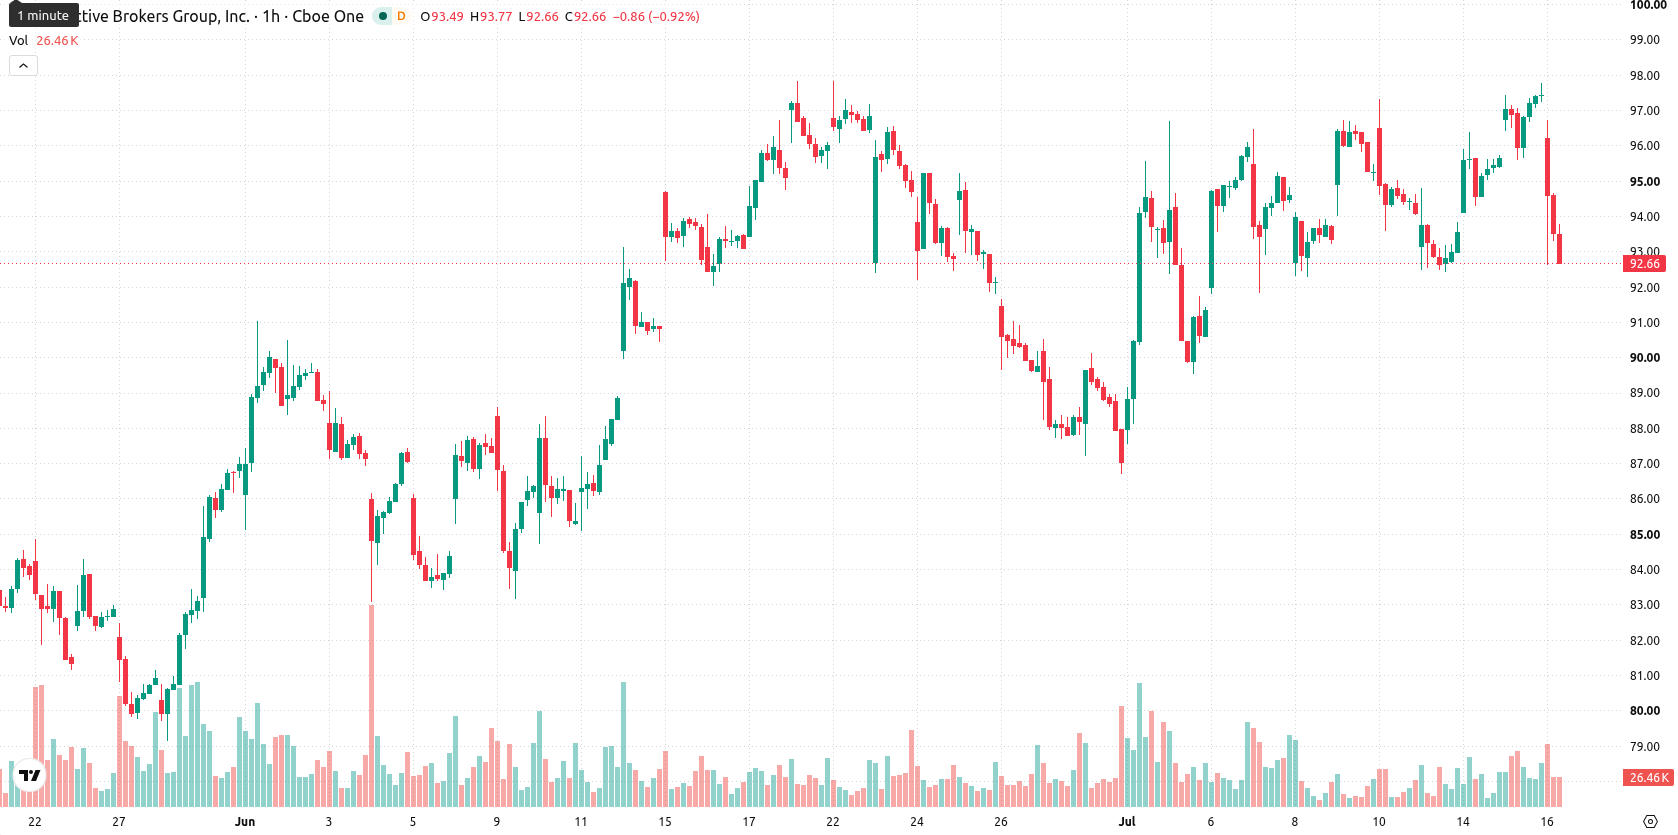
Interactive Brokers Group, Inc. (IBKR) stock is trading at $93, down 4.53% on the day and near the session low amid elevated volatility. The price is positioned below its key short- and medium-term moving averages, reflecting immediate weakness in the stock’s momentum.
 92.01
97.77
92.01
97.77
Highlights
- Tickmill UK's partnership with Interactive Brokers expands multi-asset market access, potentially driving higher transaction volumes on IBKR’s platform.
- This collaboration underscores IBKR’s institutional appeal and suggests incremental revenue potential from increased international client flows.
- IBKR/USD faces short-term bearish momentum below key moving averages, with a forecasted range of $90.6 to $95.71 and greater probability of further downside pressure.
Institutional flows expand as Tickmill leverages IBKR infrastructure
Tickmill UK has initiated a new multi-asset service that gives eligible clients broader access to global markets by utilizing the trading infrastructure of Interactive Brokers, according to Tradingview. This arrangement may expand the volume of routes and client transactions handled by IBKR, reflecting its continuing appeal to institutional partners seeking reliable access to international assets. The development points to potential incremental revenue from increased transaction flows, though price action has remained under broader selling pressure.
Diverging momentum signals as oversold conditions meet trend support
On the H1 timeframe, IBKR is trading below both the 20-period moving average at $95.34 and the 50-period moving average at $94.8, with the immediate Ichimoku Kijun resistance marked at $95.07. On the daily chart, IBKR is holding above the 200-period moving average at $74.73, indicating the longer-term uptrend remains intact despite recent weakness. Momentum signals provide mixed readings: the Moving Average Convergence Divergence (MACD) indicates strong buying potential, the Average Directional Index (ADX) is neutral, and the Relative Strength Index (RSI) sits at 39.91, pointing to underlying selling pressure. Both Stochastic RSI and Commodity Channel Index (CCI) are oversold, highlighting possible exhaustion among sellers, while Bull/Bear Power confirms sellers are currently dominating intraday momentum; the Awesome Oscillator remains neutral, offering no additional directional guidance. The divergence between oversold oscillators and the MACD’s bullish bias underscores a market in transition with underlying indecision.
Downside risk prevails as price likely consolidates within volatile range
Over the next 2–3 trading days, IBKR is likely to trade within a volatility band between $90.6 and $95.71. The probability of further downside is 57%, while the chance of a rebound is 43%, indicating that an upward move is less favored under current conditions. The baseline scenario anticipates consolidation within this range. If IBKR breaks above immediate resistance at $95.07, a bullish move is possible, while a sustained breach below $90.6 would likely lead to accelerated downside pressure.
Earlier, analysts noted that Interactive Brokers was exhibiting resilient underlying growth and maintaining a constructive technical outlook. The current analysis highlights a period of market transition marked by elevated volatility and mixed momentum signals, making the upcoming breakout from the $90.6–$95.71 consolidation band a crucial trigger for traders to monitor.


Latest Interactive Brokers News






-
 Afghanistan
-
 Albania
-
 Algeria
-
 Angola
-
 Argentina
-
 Armenia
-
 Australia
-
 Austria
-
 Azerbaijan
-
 Bahamas
-
 Bahrain
-
 Bangladesh
-
 Belarus
-
 Belgium
-
 Bolivia
-
 Botswana
-
 Brazil
-
 Brunei
-
 Bulgaria
-
 Cambodia
-
 Cameroon
-
 Canada
-
 Chile
Chile
-
 China
China
-
 Colombia
-
 Congo
Congo
-
 Costa Rica
-
 Cote d'Ivoire
-
 Croatia
-
 Cuba
Cuba
-
 Cyprus
-
 Czechia
-
 DR Congo
-
 Denmark
-
 Dominican Republic
-
 Ecuador
-
 Egypt
Egypt
-
 El Salvador
-
 Estonia
-
 Eswatini
-
 Ethiopia
-
 Finland
-
 France
-
 Georgia
-
 Germany
-
 Ghana
Ghana
-
 Greece
-
 Haiti
Haiti
-
 Hong Kong
-
 Hungary
-
 India
India
-
 Indonesia
-
 Iran, Islamic republic
-
 Iraq
Iraq
-
 Ireland
-
 Israel
-
 Italy
Italy
-
 Jamaica
-
 Japan
Japan
-
 Jordan
-
 Kazakhstan
-
 Kenya
Kenya
-
 Korea
Korea
-
 Kuwait
-
 Kyrgyzstan
-
 Laos
Laos
-
 Latvia
-
 Lebanon
-
 Lesotho
-
 Libya
Libya
-
 Lithuania
-
 Luxembourg
-
 Madagascar
-
 Malaysia
-
 Malta
Malta
-
 Mauritius
-
 Mexico
-
 Moldova
-
 Mongolia
-
 Montenegro
-
 Morocco
-
 Mozambique
-
 Myanmar
-
 Namibia
-
 Nepal
Nepal
-
 Netherlands
-
 New Zealand
-
 Nigeria
-
 North Macedonia
-
 Norway
-
 Oman
Oman
-
 Pakistan
-
 Palestine
-
 Panama
-
 Papua New Guinea
-
 Paraguay
-
 Peru
Peru
-
 Philippines
-
 Poland
-
 Portugal
-
 Puerto Rico
-
 Qatar
Qatar
-
 Reunion
-
 Romania
-
 Rwanda
-
 Saudi Arabia
-
 Serbia
-
 Singapore
-
 Slovakia
-
 Slovenia
-
 Somalia
-
 South Africa
-
 Spain
Spain
-
 Sri Lanka
-
 Sweden
-
 Switzerland
-
 Syria
Syria
-
 Taiwan
-
 Tajikistan
-
 Tanzania
-
 Thailand
-
 Trinidad and Tobago
-
 Tunisia
-
 Turkey
-
 UAE
UAE
-
 Uganda
-
 Ukraine
-
 United Kingdom
-
United States
-
 Uruguay
-
 Uzbekistan
-
 Venezuela
-
 Vietnam
-
 Yemen
Yemen
-
 Zambia
-
 Zimbabwe
- Forex
- Crypto











