
Buyer dominance drives rally. Can MDLZ extend gains above $62.46 resistance?

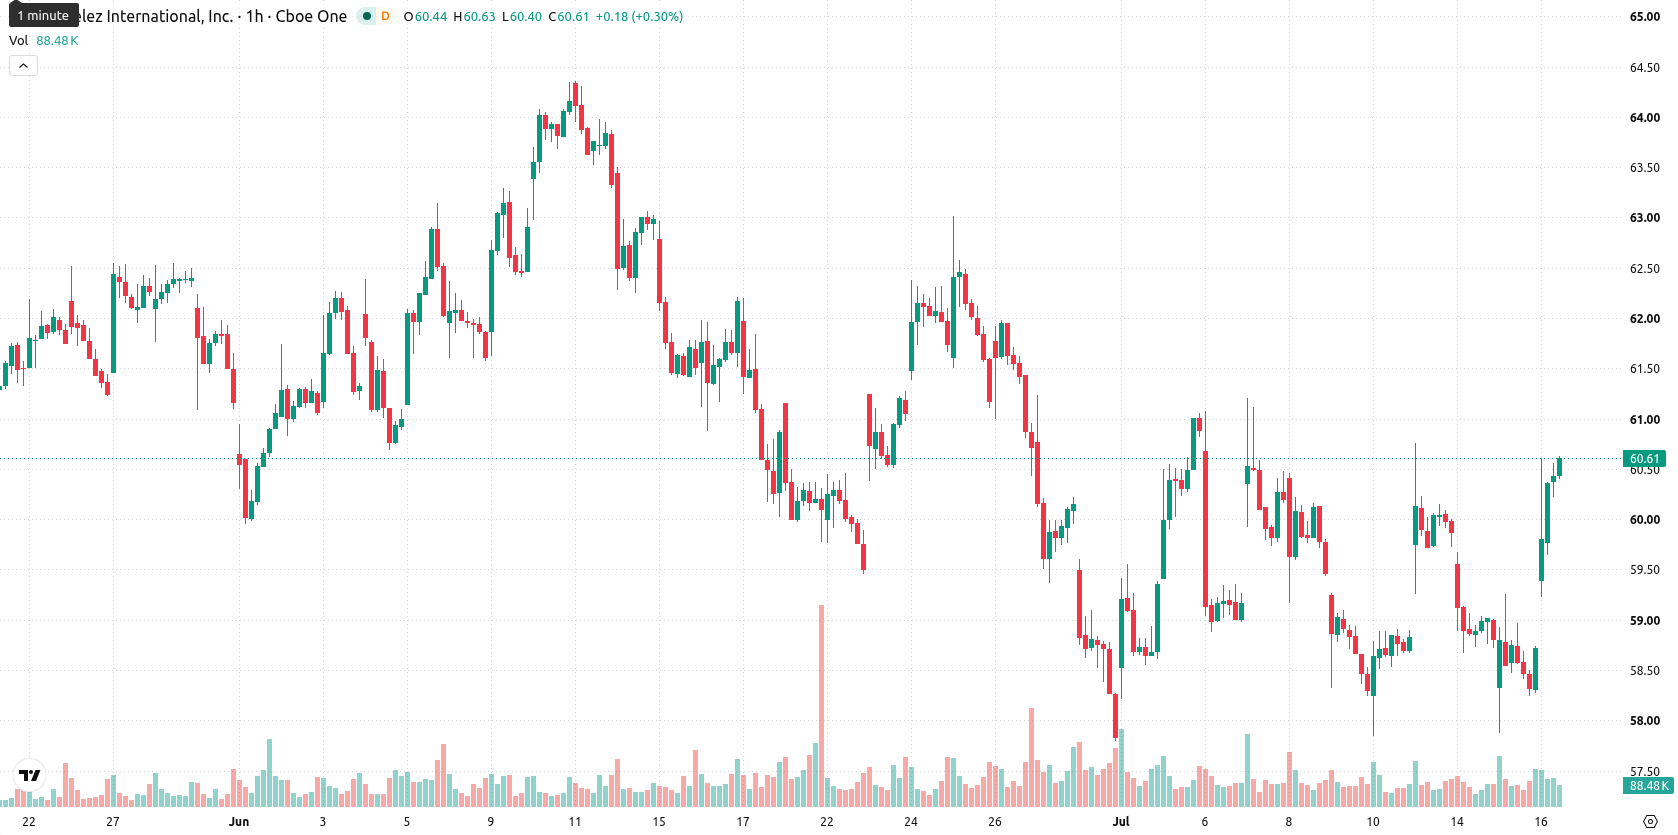
Mondelez International, Inc. (MDLZ) stock is trading at $60.55, advancing 3.13% on the day. The price sits firmly above its key moving averages, reflecting strong underlying momentum.
 61.40
60.78
61.40
60.78
Highlights
- MDLZ exhibits persistent bullish momentum, supported by strong price action above key moving averages on multiple timeframes.
- Momentum indicators remain overbought, confirming intraday buying strength but hinting at potential near-term consolidation or retracement.
- Expected trading range is $59.42 to $62.46, with 71% probability of an upside move barring a breakdown below $59.33 support.
Overbought signals intensify as momentum faces divergence
On the H1 chart, MDLZ is positioned above its 20-period and 50-period moving averages, as well as well above the 200-period moving average on the daily chart. Immediate support is found at the Ichimoku Kijun level of $59.33. The Moving Average Convergence Divergence (MACD) signals a buy, and the Average Directional Index (ADX) indicates neutral market strength. The Relative Strength Index (RSI) and Stochastic RSI are both in overbought territory, while the Commodity Channel Index (CCI) and Bull/Bear Power are also overbought, suggesting strong short-term buyer dominance. The Awesome Oscillator further confirms upward momentum, though all overbought oscillators signal that some divergence is emerging as momentum tempers.
Sideways bias persists as breakout and pullback risks coexist
In the near term, MDLZ is expected to trade within a volatility band ranging from $59.42 to $62.46. There is a 71% probability of a further upward move, while the chance of a pullback is estimated at 29%. The baseline scenario calls for MDLZ to remain within a sideways range. A push above $62.46 would signal a bullish breakout, whereas a decline below the $59.33 support would suggest the start of a bearish phase.
Earlier, analysts noted that Mondelez’s technical posture was under pressure, with expectations for continued volatility and cautious sentiment. The recent upswing and renewed momentum indicate a shift toward a more constructive outlook, making $62.46 the key level to watch for a potential breakout.









-
 Afghanistan
-
 Albania
-
 Algeria
-
 Angola
-
 Argentina
-
 Armenia
-
 Australia
-
 Austria
-
 Azerbaijan
-
 Bahamas
-
 Bahrain
-
 Bangladesh
-
 Belarus
-
 Belgium
-
 Bolivia
-
 Botswana
-
 Brazil
-
 Brunei
-
 Bulgaria
-
 Cambodia
-
 Cameroon
-
 Canada
-
 Chile
Chile
-
 China
China
-
 Colombia
-
 Congo
Congo
-
 Costa Rica
-
 Cote d'Ivoire
-
 Croatia
-
 Cuba
Cuba
-
 Cyprus
-
 Czechia
-
 DR Congo
-
 Denmark
-
 Dominican Republic
-
 Ecuador
-
 Egypt
Egypt
-
 El Salvador
-
 Estonia
-
 Eswatini
-
 Ethiopia
-
 Finland
-
 France
-
 Georgia
-
 Germany
-
 Ghana
Ghana
-
 Greece
-
 Haiti
Haiti
-
 Hong Kong
-
 Hungary
-
 India
India
-
 Indonesia
-
 Iran, Islamic republic
-
 Iraq
Iraq
-
 Ireland
-
 Israel
-
 Italy
Italy
-
 Jamaica
-
 Japan
Japan
-
 Jordan
-
 Kazakhstan
-
 Kenya
Kenya
-
 Korea
Korea
-
 Kuwait
-
 Kyrgyzstan
-
 Laos
Laos
-
 Latvia
-
 Lebanon
-
 Lesotho
-
 Libya
Libya
-
 Lithuania
-
 Luxembourg
-
 Madagascar
-
 Malaysia
-
 Malta
Malta
-
 Mauritius
-
 Mexico
-
 Moldova
-
 Mongolia
-
 Montenegro
-
 Morocco
-
 Mozambique
-
 Myanmar
-
 Namibia
-
 Nepal
Nepal
-
 Netherlands
-
 New Zealand
-
 Nigeria
-
 North Macedonia
-
 Norway
-
 Oman
Oman
-
 Pakistan
-
 Palestine
-
 Panama
-
 Papua New Guinea
-
 Paraguay
-
 Peru
Peru
-
 Philippines
-
 Poland
-
 Portugal
-
 Puerto Rico
-
 Qatar
Qatar
-
 Reunion
-
 Romania
-
 Rwanda
-
 Saudi Arabia
-
 Serbia
-
 Singapore
-
 Slovakia
-
 Slovenia
-
 Somalia
-
 South Africa
-
 Spain
Spain
-
 Sri Lanka
-
 Sweden
-
 Switzerland
-
 Syria
Syria
-
 Taiwan
-
 Tajikistan
-
 Tanzania
-
 Thailand
-
 Trinidad and Tobago
-
 Tunisia
-
 Turkey
-
 UAE
UAE
-
 Uganda
-
 Ukraine
-
 United Kingdom
-
United States
-
 Uruguay
-
 Uzbekistan
-
 Venezuela
-
 Vietnam
-
 Yemen
Yemen
-
 Zambia
-
 Zimbabwe
- Forex
- Crypto











