
Microsoft slips to $496 as sellers break key trendline and test long-term support

Microsoft Corp. continues to weaken after losing a critical support zone, with price now trading near $496, marking the lowest level since early summer. The breakdown below both the 20-day and 50-day EMAs confirms a shift in momentum following months of steady accumulation.
Highlights
- Microsoft breaks below $501 support, confirming a structural downtrend.
- Price tests $496 as the 100-day EMA near $478 becomes the next key level.
- Long-term bullish narrative remains tied to AI and enterprise cloud growth.
The fall accelerated once buyers failed to defend the 0.382 Fibonacci retracement around $516, signaling that this correction is more structural than routine profit-taking. The stock’s multi-month uptrend channel from April has now been breached. Microsoft fell beneath the lower boundary of the channel and the dashed trendline that had provided dynamic support through prior corrections.
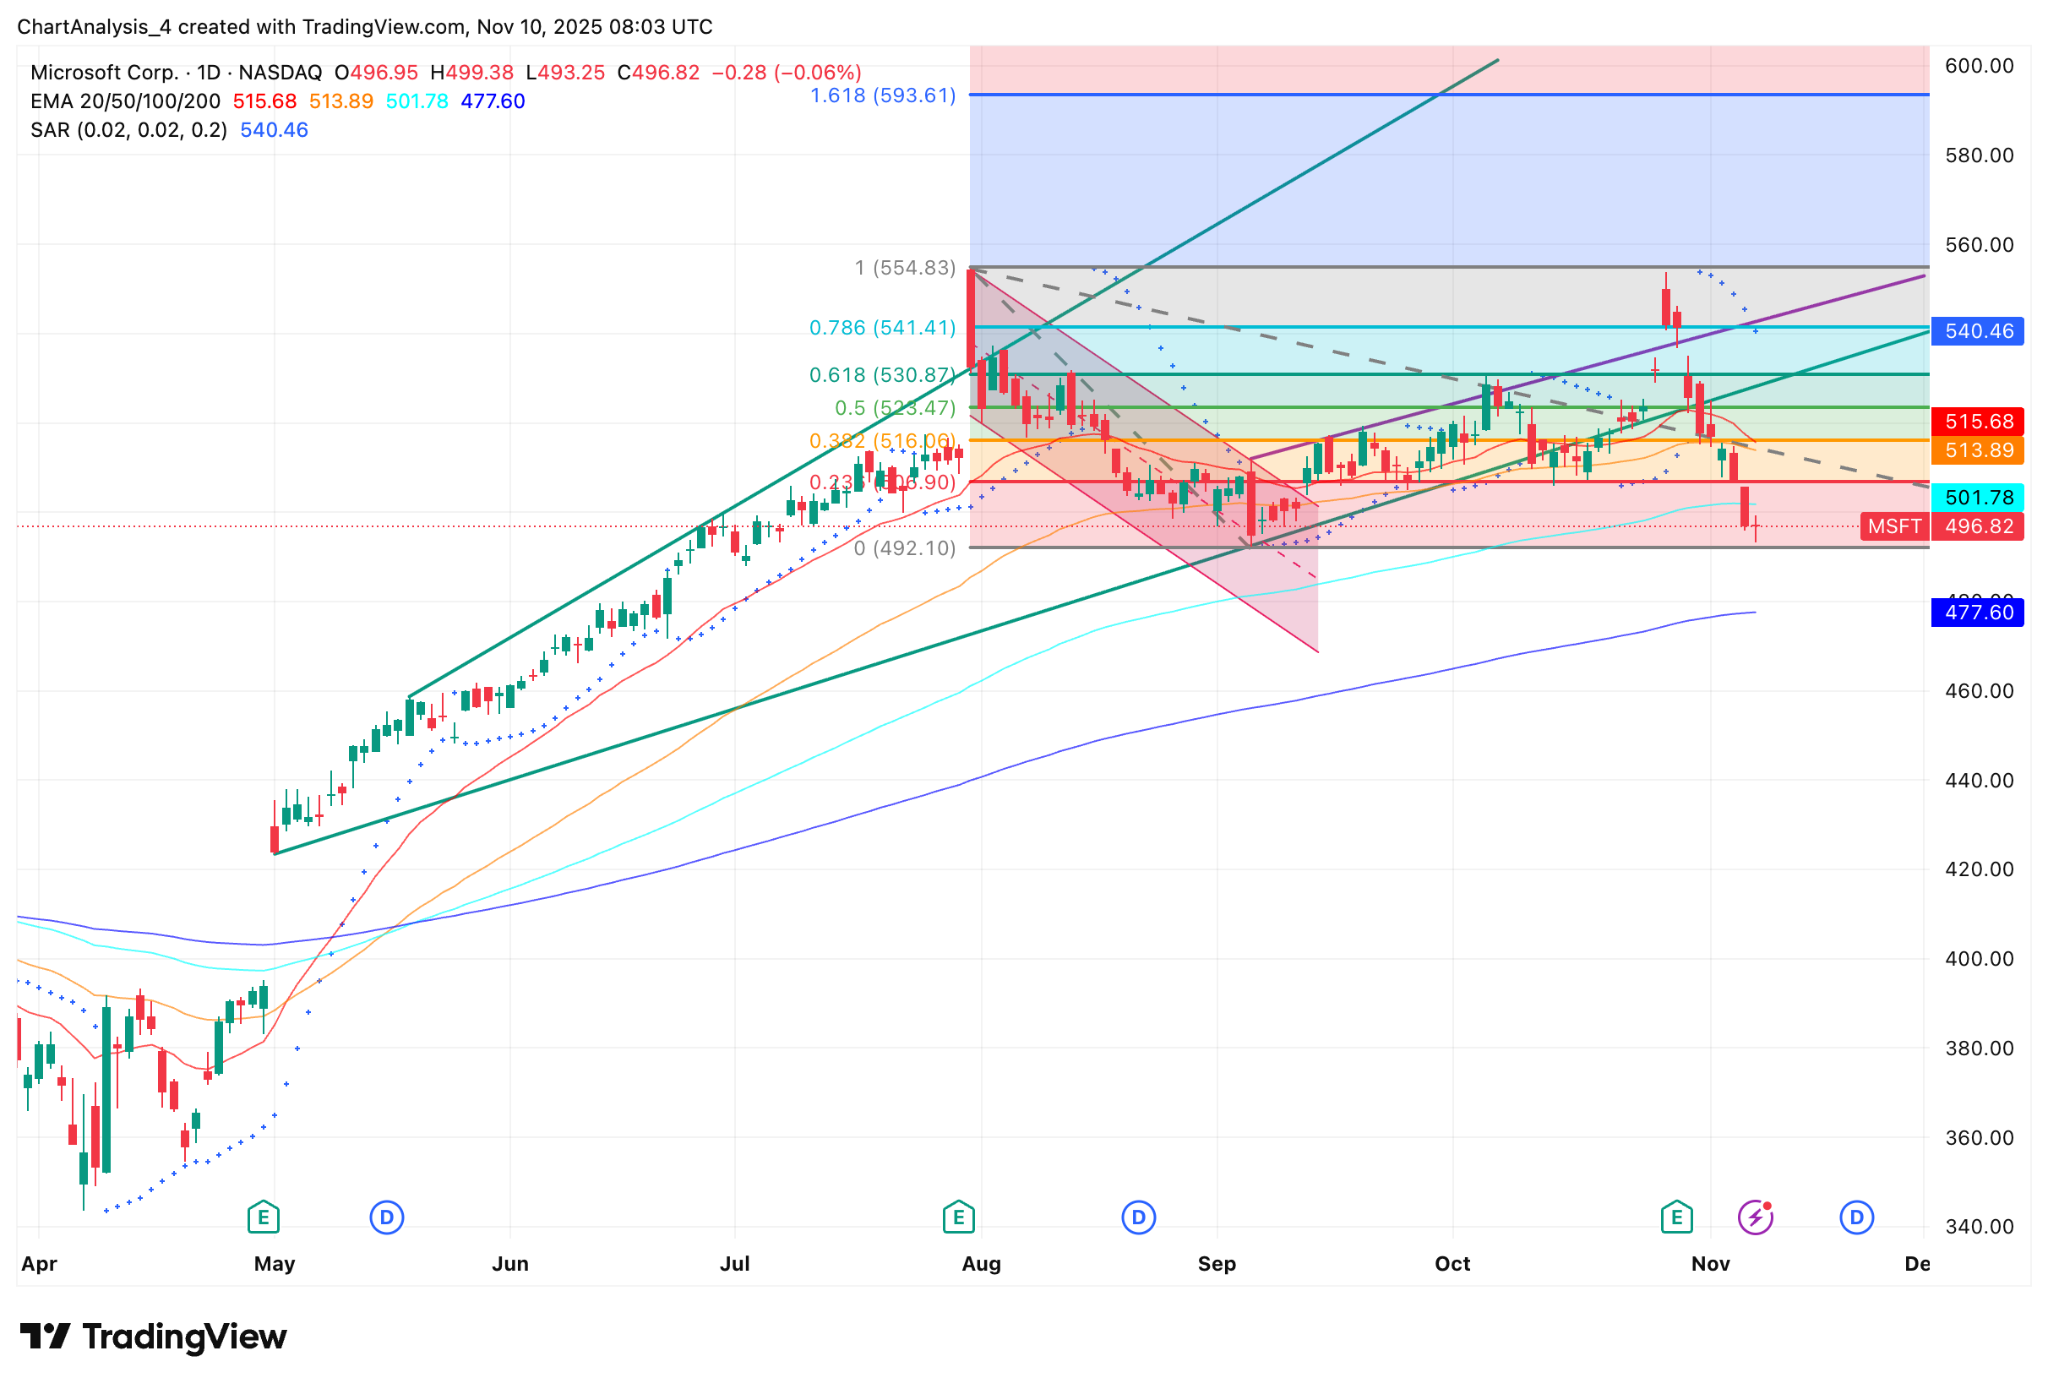
Microsoft stock price dynamics (Source: TradingView)
On the daily chart, Parabolic SAR remains above candles, underscoring the strength of the bearish momentum. The next support cluster lies near the 100-day EMA at $478, followed by the 200-day EMA around $455, which serves as a long-term gauge for institutional trend direction.
Short-term momentum remains weak
Intraday data reinforces the bearish bias. On the 30-minute chart, Supertrend flipped negative on November 5 and has yet to reverse. Every rebound attempt has been rejected beneath the baseline, showing that sellers remain in control of short-term price action. Meanwhile, RSI has steadied near 40 but shows no sign of bullish divergence, suggesting that momentum has not yet turned.
For the near term, Microsoft must close above $501 to confirm that selling pressure is easing. Failing that, the next key test arrives at the 100-day EMA near $478, where long-term buyers may attempt to re-enter. Below that, the 200-day EMA around $455 represents the last major defense level before a full trend reversal develops.
Long-term outlook still anchored in AI leadership
Despite the short-term weakness, the underlying business story remains supportive. Microsoft continues to sit at the center of the global race for artificial intelligence infrastructure, spanning its Azure cloud platform, enterprise copilots, and strategic partnership with OpenAI. These initiatives underpin the company’s leadership in AI adoption, giving long-term investors confidence that the broader uptrend will eventually resume once technical levels stabilize.
For now, however, Microsoft is undergoing a cooling phase as the market digests months of heavy positioning. The key question is whether institutional buyers defend the 100-day EMA or allow the stock to drift toward the 200-day level. The trend only shifts decisively bullish again once the price reclaims $516, the midpoint of the recent Fibonacci zone and the former breakout level.
Earlier analysis highlighted the $516–$520 band as Microsoft’s structural pivot and the first sign of trend exhaustion if breached. The subsequent breakdown has validated that view, turning the focus toward medium-term supports near $478 and $455. Historically, pullbacks toward the 100-day or 200-day EMAs have triggered renewed accumulation among long-term investors. Whether that pattern holds again will determine if the current decline becomes a consolidation phase or the start of a larger reset.


Latest Microsoft News


-
 Afghanistan
-
 Albania
-
 Algeria
-
 Angola
-
 Argentina
-
 Armenia
-
 Australia
-
 Austria
-
 Azerbaijan
-
 Bahamas
-
 Bahrain
-
 Bangladesh
-
 Belarus
-
 Belgium
-
 Bolivia
-
 Botswana
-
 Brazil
-
 Brunei
-
 Bulgaria
-
 Cambodia
-
 Cameroon
-
 Canada
-
 Chile
Chile
-
 China
China
-
 Colombia
-
 Congo
Congo
-
 Costa Rica
-
 Cote d'Ivoire
-
 Croatia
-
 Cuba
Cuba
-
 Cyprus
-
 Czechia
-
 DR Congo
-
 Denmark
-
 Dominican Republic
-
 Ecuador
-
 Egypt
Egypt
-
 El Salvador
-
 Estonia
-
 Eswatini
-
 Ethiopia
-
 Finland
-
 France
-
 Georgia
-
 Germany
-
 Ghana
Ghana
-
 Greece
-
 Haiti
Haiti
-
 Hong Kong
-
 Hungary
-
 India
India
-
 Indonesia
-
 Iran, Islamic republic
-
 Iraq
Iraq
-
 Ireland
-
 Israel
-
 Italy
Italy
-
 Jamaica
-
 Japan
Japan
-
 Jordan
-
 Kazakhstan
-
 Kenya
Kenya
-
 Korea
Korea
-
 Kuwait
-
 Kyrgyzstan
-
 Laos
Laos
-
 Latvia
-
 Lebanon
-
 Lesotho
-
 Libya
Libya
-
 Lithuania
-
 Luxembourg
-
 Madagascar
-
 Malaysia
-
 Malta
Malta
-
 Mauritius
-
 Mexico
-
 Moldova
-
 Mongolia
-
 Montenegro
-
 Morocco
-
 Mozambique
-
 Myanmar
-
 Namibia
-
 Nepal
Nepal
-
 Netherlands
-
 New Zealand
-
 Nigeria
-
 North Macedonia
-
 Norway
-
 Oman
Oman
-
 Pakistan
-
 Palestine
-
 Panama
-
 Papua New Guinea
-
 Paraguay
-
 Peru
Peru
-
 Philippines
-
 Poland
-
 Portugal
-
 Puerto Rico
-
 Qatar
Qatar
-
 Reunion
-
 Romania
-
 Rwanda
-
 Saudi Arabia
-
 Serbia
-
 Singapore
-
 Slovakia
-
 Slovenia
-
 Somalia
-
 South Africa
-
 Spain
Spain
-
 Sri Lanka
-
 Sweden
-
 Switzerland
-
 Syria
Syria
-
 Taiwan
-
 Tajikistan
-
 Tanzania
-
 Thailand
-
 Trinidad and Tobago
-
 Tunisia
-
 Turkey
-
 UAE
UAE
-
 Uganda
-
 Ukraine
-
 United Kingdom
-
United States
-
 Uruguay
-
 Uzbekistan
-
 Venezuela
-
 Vietnam
-
 Yemen
Yemen
-
 Zambia
-
 Zimbabwe
- Forex
- Crypto
