
Microsoft edges higher as rebound tests major resistance after sharp selloff

Microsoft climbed back to $485 on Wednesday, extending its rebound from this week’s lows and offering the first clear sign of stability after a multi-session decline that pressured the stock to its weakest levels in months. The slide, which began in early November, accelerated after the stock lost the $500 handle and fell toward its 200-day EMA for the first time since April.
Highlights
- Microsoft rebounds to $485 as buyers defend long-term support.
- Stock approaches heavy resistance between the $495–$505 EMA cluster.
- Key trendline test ahead will determine if the recovery becomes a full reversal.
Investors rotated out of mega-cap technology stocks and into defensives during the broader market reset, and the cooling in AI-linked enthusiasm added further weight. The latest rebound now centers on whether Microsoft can regain momentum after a disciplined response from long-term buyers.
Recovery tests steep downtrend as price approaches key inflection zone
The technical picture captures a market pressing against a major decision point. Microsoft continues to trade directly beneath the steep descending trendline originating from the November peak near $560. Each recovery attempt has stalled at this line, and Wednesday’s move places the stock within reach of another retest. The rebound from $468 — which aligns with the 200-day EMA and the lower Bollinger Band — reflects strong demand from institutions that typically defend long-term accumulation zones.
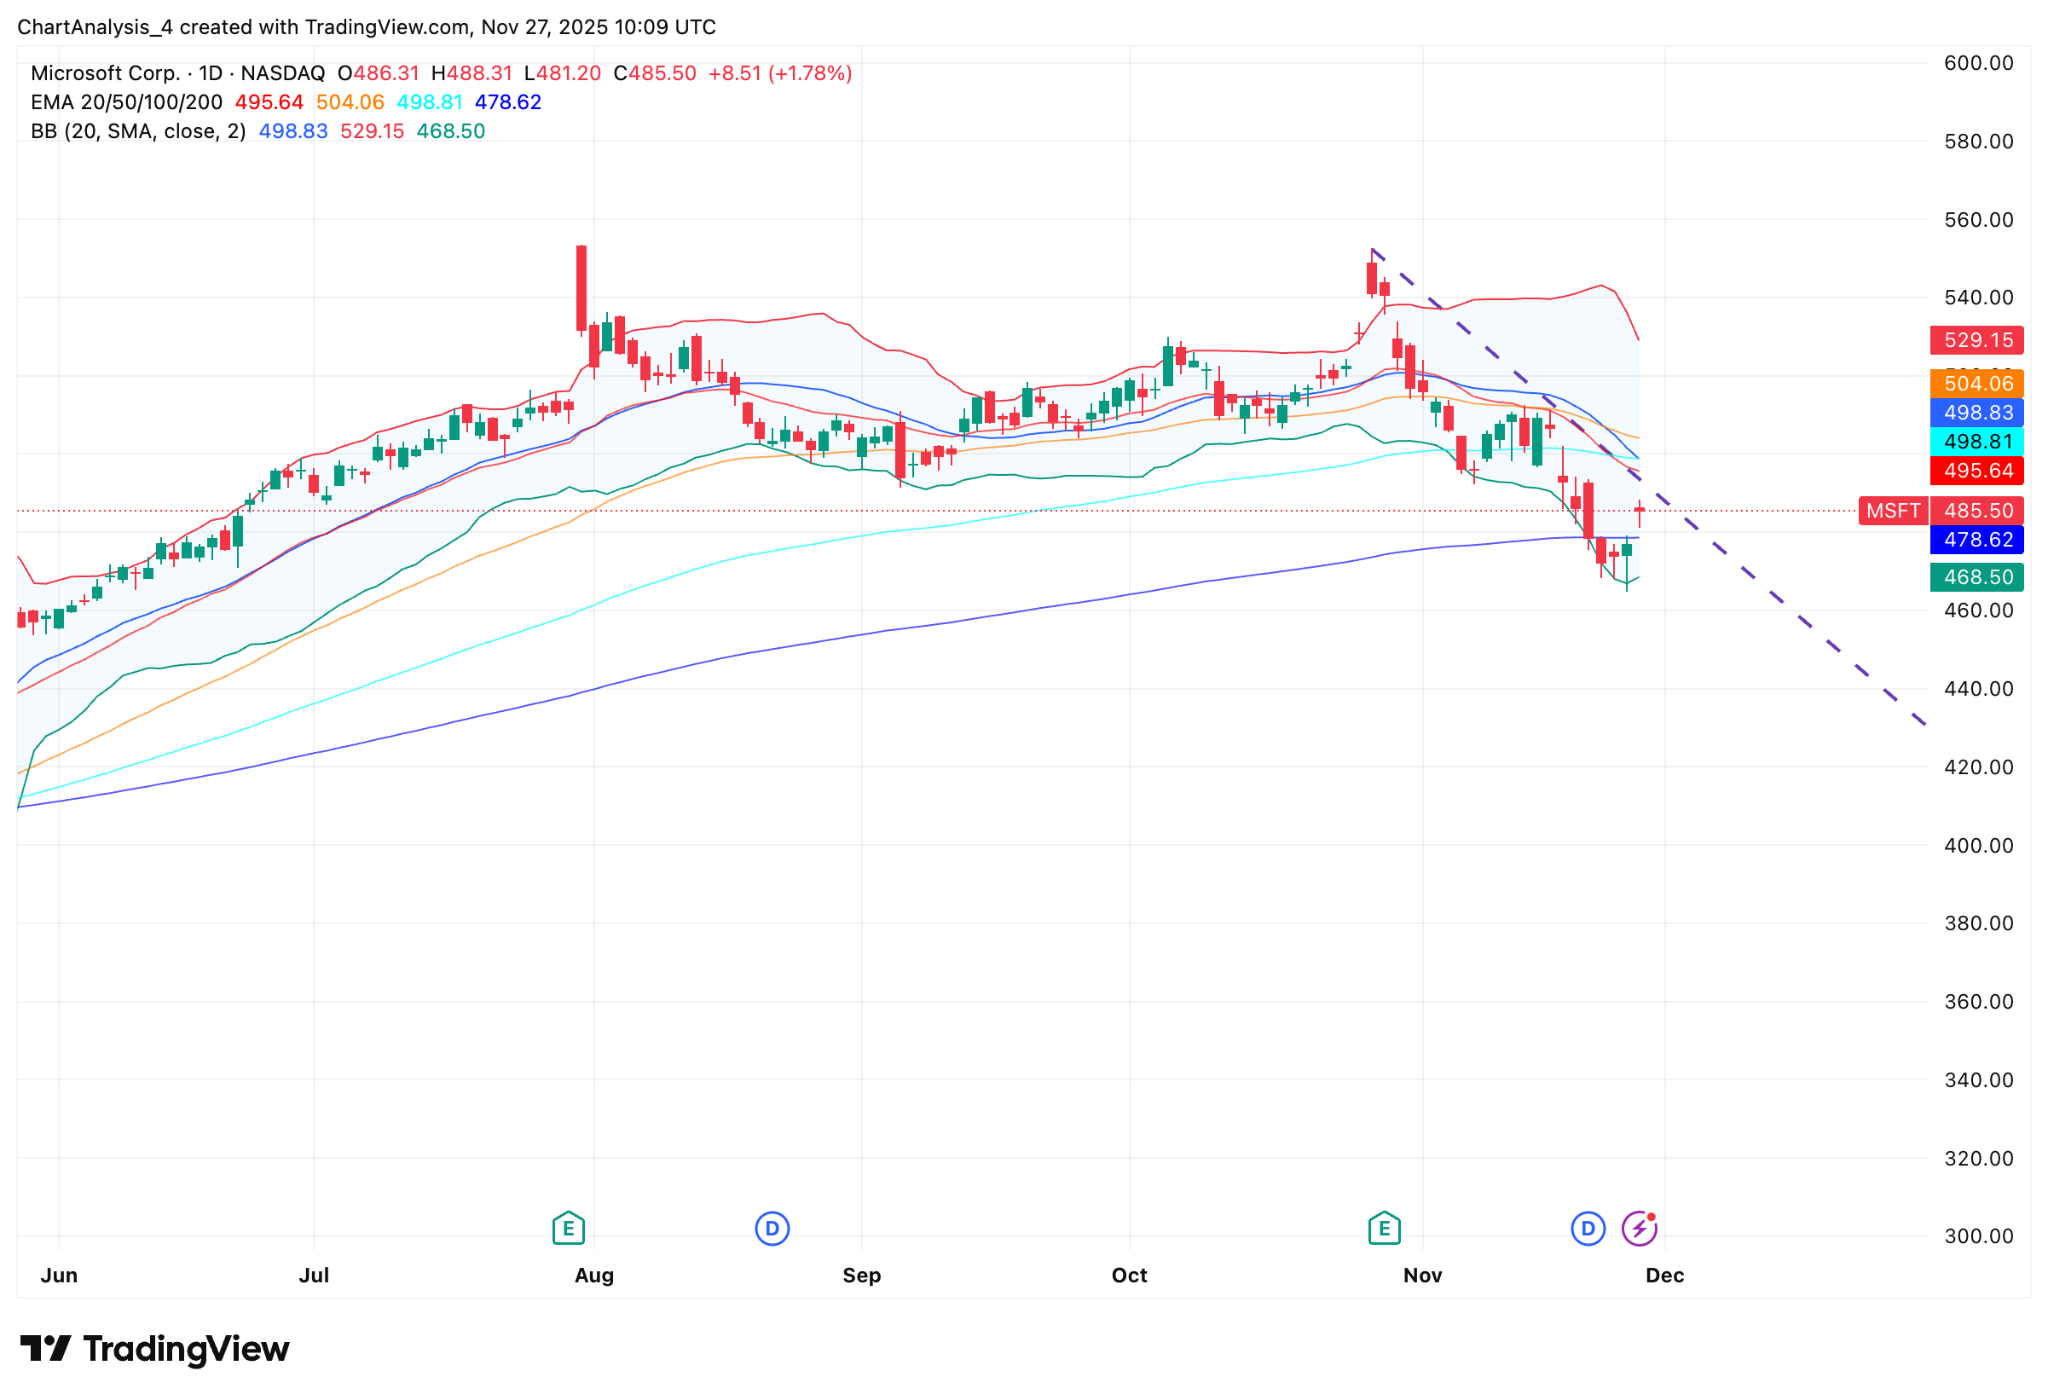
MSFT price dynamics (Source: TradingView)
The Bollinger Bands, which widened sharply during the selloff, have begun to contract as volatility cools. Price is now approaching the mid-band at $498, the level that often dictates whether a reversal gains traction or fades back into consolidation. A sustained close above this mark would represent the first meaningful shift in short-term momentum.
EMA cluster overhead creates a critical resistance belt for buyers
Despite Wednesday’s advance, the recovery still carries significant technical hurdles. Microsoft remains below the 20-day EMA at $495, the 50-day EMA at $504, and the 100-day EMA at $498. All three averages have turned lower and now sit above spot price in a bearish formation. This alignment forms a compressed resistance belt between $495 and $505 — a region that bulls must reclaim to shift the medium-term structure back in their favor.
Short-term momentum indicators offer mixed signals. On the intraday chart, the RSI has surged toward 60–69, indicating a sharp improvement from oversold conditions. VWAP has also been reclaimed, signaling that buyers have regained control intraday after several sessions of heavy distribution. Yet the daily Supertrend remains bearish and sits at $507. A break above this threshold would flip the indicator positive and confirm that the corrective phase is losing influence.
Long-term structure remains intact as institutional flows defend 200-day trend
Even with the volatility of the past two weeks, Microsoft remains structurally sound. The stock continues to trade above its rising 200-day EMA and well over the long-term trendline drawn from the March breakout. The selloff never threatened a deeper technical breakdown; instead, price returned to historical demand levels where institutions traditionally rebuild exposure. The force of the rebound at $468 reinforces this dynamic and suggests that long-term flows remain constructive.
The immediate test sits just overhead at the descending trendline. A breakout would open the path toward $498, $505, and $519, where the Supertrend flips and prior consolidation developed earlier in the quarter. A failure at this level would leave Microsoft vulnerable to a return toward $472–$468, the region where dip-buyers stepped in decisively earlier this week.
What comes next as sentiment toward tech stabilizes
For now, Microsoft sits at a crossroads: a stock recovering from its deepest pullback in months while approaching a wall of resistance. Sentiment across the broader technology sector has steadied after weeks of pressure, but investors remain watchful as macro expectations, cloud-demand outlooks, and AI spending narratives continue to shift. Whether Microsoft can close above the $495–$505 resistance zone will determine if the rebound evolves into a broader recovery or stalls into another period of consolidation.
In earlier analysis, we highlighted that Microsoft’s vulnerability below $500 placed the stock at risk of testing deeper supports unless buyers defended the long-term trend. The rebound from $468 confirms that institutional flows remain intact and that the 200-day EMA continues to serve as a critical foundation for the stock’s larger structure.


Latest Microsoft News


-
 Afghanistan
-
 Albania
-
 Algeria
-
 Angola
-
 Argentina
-
 Armenia
-
 Australia
-
 Austria
-
 Azerbaijan
-
 Bahamas
-
 Bahrain
-
 Bangladesh
-
 Belarus
-
 Belgium
-
 Bolivia
-
 Botswana
-
 Brazil
-
 Brunei
-
 Bulgaria
-
 Cambodia
-
 Cameroon
-
 Canada
-
 Chile
Chile
-
 China
China
-
 Colombia
-
 Congo
Congo
-
 Costa Rica
-
 Cote d'Ivoire
-
 Croatia
-
 Cuba
Cuba
-
 Cyprus
-
 Czechia
-
 DR Congo
-
 Denmark
-
 Dominican Republic
-
 Ecuador
-
 Egypt
Egypt
-
 El Salvador
-
 Estonia
-
 Eswatini
-
 Ethiopia
-
 Finland
-
 France
-
 Georgia
-
 Germany
-
 Ghana
Ghana
-
 Greece
-
 Haiti
Haiti
-
 Hong Kong
-
 Hungary
-
 India
India
-
 Indonesia
-
 Iran, Islamic republic
-
 Iraq
Iraq
-
 Ireland
-
 Israel
-
 Italy
Italy
-
 Jamaica
-
 Japan
Japan
-
 Jordan
-
 Kazakhstan
-
 Kenya
Kenya
-
 Korea
Korea
-
 Kuwait
-
 Kyrgyzstan
-
 Laos
Laos
-
 Latvia
-
 Lebanon
-
 Lesotho
-
 Libya
Libya
-
 Lithuania
-
 Luxembourg
-
 Madagascar
-
 Malaysia
-
 Malta
Malta
-
 Mauritius
-
 Mexico
-
 Moldova
-
 Mongolia
-
 Montenegro
-
 Morocco
-
 Mozambique
-
 Myanmar
-
 Namibia
-
 Nepal
Nepal
-
 Netherlands
-
 New Zealand
-
 Nigeria
-
 North Macedonia
-
 Norway
-
 Oman
Oman
-
 Pakistan
-
 Palestine
-
 Panama
-
 Papua New Guinea
-
 Paraguay
-
 Peru
Peru
-
 Philippines
-
 Poland
-
 Portugal
-
 Puerto Rico
-
 Qatar
Qatar
-
 Reunion
-
 Romania
-
 Rwanda
-
 Saudi Arabia
-
 Serbia
-
 Singapore
-
 Slovakia
-
 Slovenia
-
 Somalia
-
 South Africa
-
 Spain
Spain
-
 Sri Lanka
-
 Sweden
-
 Switzerland
-
 Syria
Syria
-
 Taiwan
-
 Tajikistan
-
 Tanzania
-
 Thailand
-
 Trinidad and Tobago
-
 Tunisia
-
 Turkey
-
 UAE
UAE
-
 Uganda
-
 Ukraine
-
 United Kingdom
-
United States
-
 Uruguay
-
 Uzbekistan
-
 Venezuela
-
 Vietnam
-
 Yemen
Yemen
-
 Zambia
-
 Zimbabwe
- Forex
- Crypto
