

Home Depot stock remains indecisive with RSI at neutral and volatility elevated: weekly analysis

Shares of Home Depot, Inc (HD) are trading near $347 after climbing nearly 4.5% over the past week, as the chart reflects a tightly coiled setup with buyers dominating the short-term action. Mixed momentum and pauses at resistance have kept the stock in a holding pattern, signaling indecision amid ongoing corporate shifts. Active news and technical signals both point to a week ahead shaped by range-bound conditions and strategic moves.
 347.70
349.73
Highlights
- Home Depot shares have advanced 4.48% over the past week, reaching the upper end of their recent trading range.
- The stock's price action is consolidating at major resistance, with mixed short-term momentum and volatility at 5.44%.
- Next week, expect consolidation between $340.95 and $349.97, with a 53% probability of an upside move to $359.28.
Strategic acquisitions and legal risks drive sentiment during the week
Home Depot remains in focus following recent strategic shifts towards professional customers — The Motley Fool reports the acquisitions of SRS Distribution and GMS are reshaping HD’s business mix and fueling market attention. Simultaneously, according to ad-hoc-news.de, strong operating cash flow in the latest fiscal year supported significant share buybacks and maintained resources for dividends and capital spending, while a class action lawsuit over the use of AI-powered license plate readers introduces legal uncertainty. Anticipation is also building for HD’s next quarterly earnings report, set for August 18, and recent product launches and changes in institutional positions, as noted by Simply Wall St and marketbeat.com, continue to influence sentiment for the week ahead.
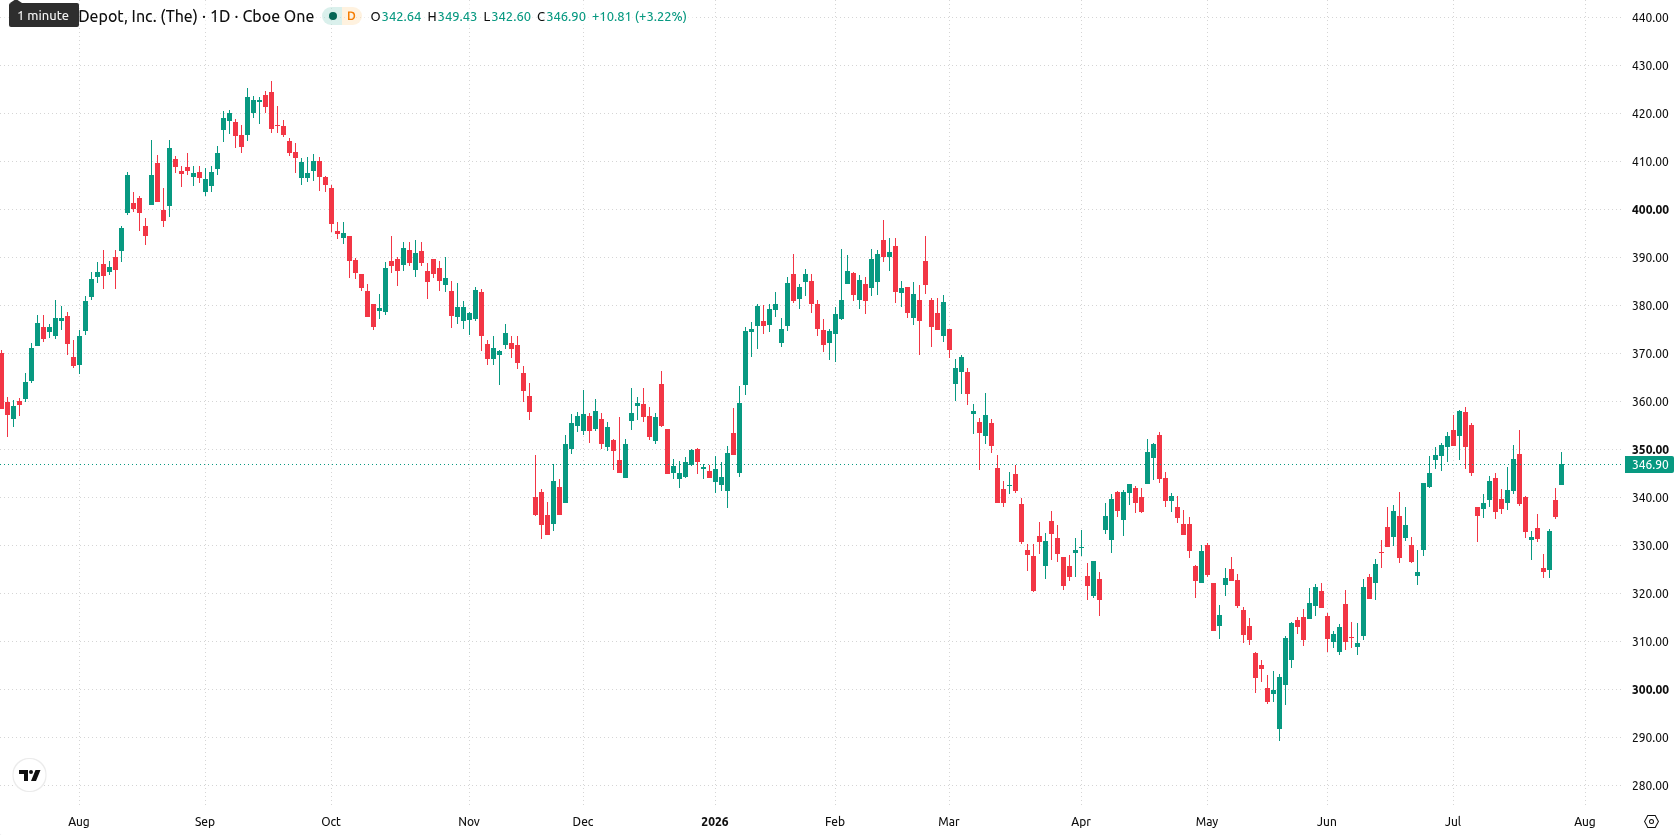
Mixed technical signals and stalled momentum anchor prices over the week
The daily chart reflects a contained move within a narrow range, as short-term momentum readings are mixed: RSI sits at a neutral 50.27, while Bull/Bear Power points to overbought conditions. Despite a strong 5.44% volatility over the past week, trend strength is flat, and major support and resistance are defined by the 20-day moving average at $340.95 and the 200-day at $349.97, with the Ichimoku Kijun at $340.28 also acting as support. The overall setup signals a pause at key resistance, with momentum signals diverging and buyers dominating short-term price action.
Consolidation bias holds unless key levels break in the coming week
Over the next five trading days, the expected range for Home Depot stock is $339.38 to $359.28. The probability of an increase stands at 53%, while the probability of a decrease is 47%. The base case favors consolidation between $340.95 and $349.97, with a bullish scenario opening above resistance at $349.97 and a bearish scenario unfolding on a move below support at $340.95.
Earlier, analysts noted that Home Depot shares faced persistent selling pressure and were consolidating after a period of decline. The current technical setup, combined with increased volatility and shifting corporate developments, signals a pivotal phase in which maintaining support above $340.95 could determine whether a new bullish trend emerges or a renewed pullback dominates in the days ahead.






Latest Home Depot News




-
 Afghanistan
-
 Albania
-
 Algeria
-
 Angola
-
 Argentina
-
 Armenia
-
 Australia
-
 Austria
-
 Azerbaijan
-
 Bahamas
-
 Bahrain
-
 Bangladesh
-
 Belarus
-
 Belgium
-
 Bolivia
-
 Botswana
-
 Brazil
-
 Brunei
-
 Bulgaria
-
 Cambodia
-
 Cameroon
-
 Canada
-
 Chile
-
 China
-
 Colombia
-
 Congo
-
 Costa Rica
-
 Cote d'Ivoire
-
 Croatia
-
 Cuba
-
 Cyprus
-
 Czechia
-
 DR Congo
-
 Denmark
-
 Dominican Republic
-
 Ecuador
-
 Egypt
-
 El Salvador
-
 Estonia
-
 Eswatini
-
 Ethiopia
-
 Finland
-
 France
-
 Georgia
-
 Germany
-
 Ghana
-
 Greece
-
 Haiti
-
 Hong Kong
-
 Hungary
-
 India
-
 Indonesia
-
 Iran, Islamic republic
-
 Iraq
-
 Ireland
-
 Israel
-
 Italy
-
 Jamaica
-
 Japan
-
 Jordan
-
 Kazakhstan
-
 Kenya
-
 Korea
-
 Kuwait
-
 Kyrgyzstan
-
 Laos
-
 Latvia
-
 Lebanon
-
 Lesotho
-
 Libya
-
 Lithuania
-
 Luxembourg
-
 Madagascar
-
 Malaysia
-
 Malta
-
 Mauritius
-
 Mexico
-
 Moldova
-
 Mongolia
-
 Montenegro
-
 Morocco
-
 Mozambique
-
 Myanmar
-
 Namibia
-
 Nepal
-
 Netherlands
-
 New Zealand
-
 Nigeria
-
 North Macedonia
-
 Norway
-
 Oman
-
 Pakistan
-
 Palestine
-
 Panama
-
 Papua New Guinea
-
 Paraguay
-
 Peru
-
 Philippines
-
 Poland
-
 Portugal
-
 Puerto Rico
-
 Qatar
-
 Reunion
-
 Romania
-
 Rwanda
-
 Saudi Arabia
-
 Serbia
-
 Singapore
-
 Slovakia
-
 Slovenia
-
 Somalia
-
 South Africa
-
 Spain
-
 Sri Lanka
-
 Sweden
-
 Switzerland
-
 Syria
-
 Taiwan
-
 Tajikistan
-
 Tanzania
-
 Thailand
-
 Trinidad and Tobago
-
 Tunisia
-
 Turkey
-
 UAE
-
 Uganda
-
 Ukraine
-
 United Kingdom
-
United States
-
 Uruguay
-
 Uzbekistan
-
 Venezuela
-
 Vietnam
-
 Yemen
-
 Zambia
-
 Zimbabwe
- Forex
- Crypto












