

What's behind Omnicom Group's latest 4.7% stock surge?

Omnicom Group Inc. (OMC) advanced 4.67% after investors positioned ahead of its upcoming second-quarter earnings release, with demand supported by the company’s robust prior revenue growth and strong dividend metrics. Bullish alignment across all major moving averages and positive near-term technical signals further support the session's upward move.
 82.35
82.35
Highlights
- Omnicom Group posted $6.24 billion in quarterly revenue, up 69.2% year-over-year and surpassing analyst estimates.
- Dividend yield is near a three-year high at 3.8%, with institutional investors increasing positions in the prior quarter.
- Technical signals are bullish with strong upward momentum; implied trading range is $83.83 to $91.10, with high probability of further gains.
Institutional inflows and outperforming dividends support bullish sentiment
Omnicom Group is set to announce its second-quarter earnings after the market closes on July 28, 2026. The company recently reported $6.24 billion in revenue for the prior quarter, a 69.2% year-over-year increase and above analyst expectations. Its dividend yield stands near a three-year high at 3.8% with a payout ratio of 34%, while institutional investors such as First Trust Advisors LP increased holdings in the first quarter.
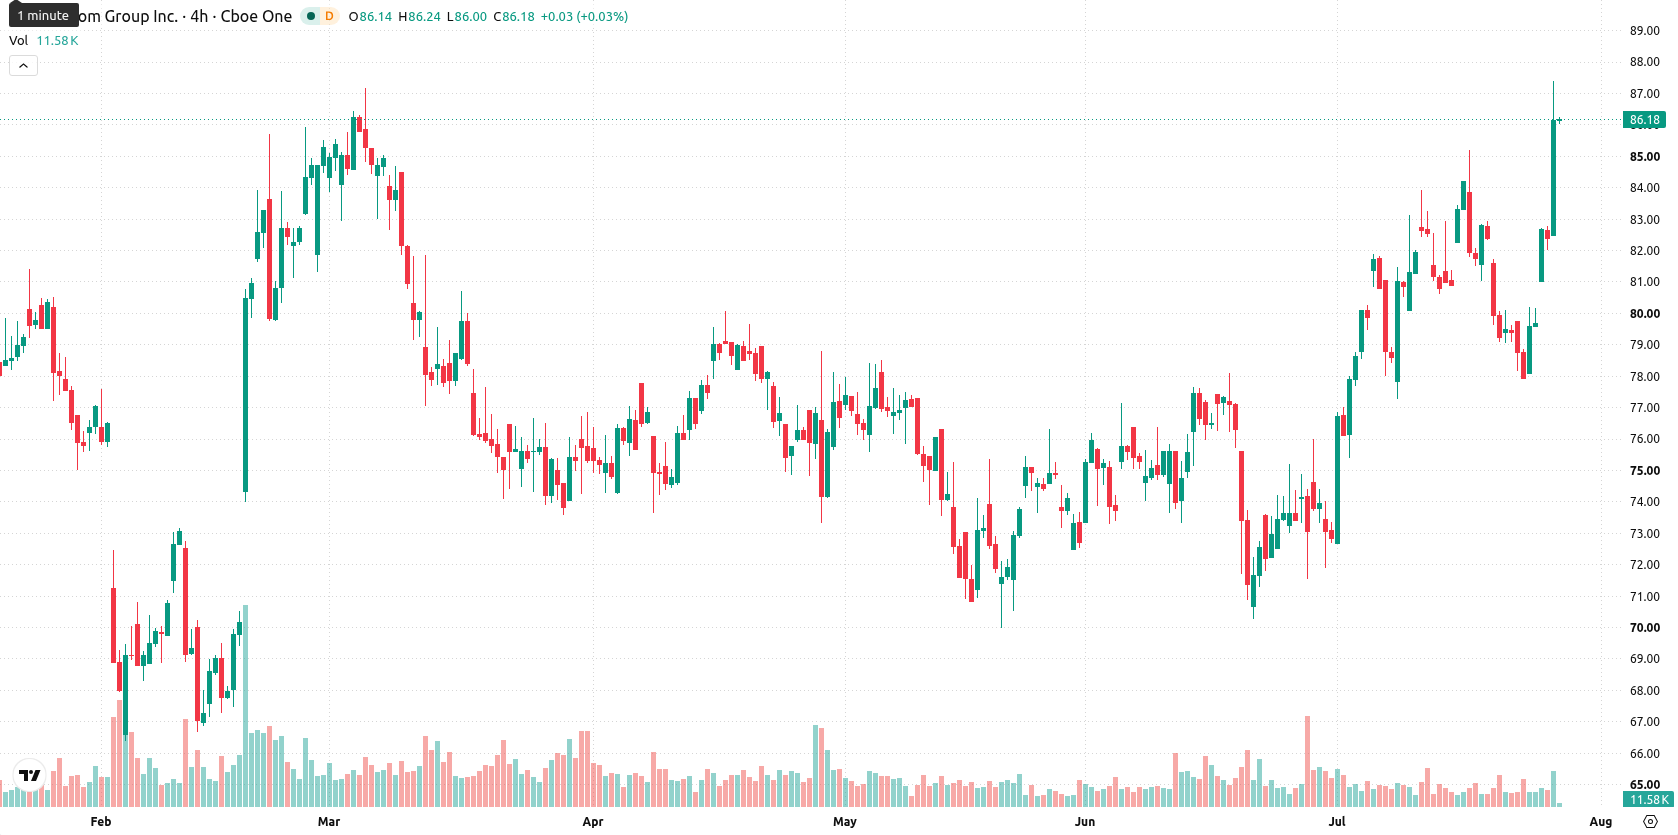
Bullish momentum persists as price tests resistance amid overbought signals
Omnicom Group is trading above its 20-day, 50-day, and 200-day moving averages at $79.73, $76.37, and $76.73, respectively, signaling bullish alignment in the short, medium, and long term. The Ichimoku Kijun at $77.69 remains far below, confirming prevailing support, with the near-term ceiling set at $87.38 and support at $83.83. Momentum signals are constructive as the Moving Average Convergence Divergence (MACD) gives a "Strong Buy" and the Average Directional Index (ADX) reads as neutral. The Relative Strength Index (RSI) is firm at 58.49, and the Commodity Channel Index (CCI) indicates buying momentum, though the Stochastic RSI is neutral. Bull/Bear Power (BBP) indicates buyer dominance at 2.58 and is currently overbought. The daily move is strong, with the stock up $3.85 or 4.67% on the session, gapping up by $0.67 (0.81%) at the open and trading near the high of its intraday range. Intraday volatility stands at 5.18%. There is notable strength toward session highs, with momentum signals largely confirming the bullish intraday tone.
Earlier, analysts noted that Omnicom Group was consolidating within a narrow trading range, with mixed momentum signals and a slight bias toward an eventual upside move. The latest surge that positions OMC well above its major moving averages, paired with strong earnings momentum, significantly strengthens the bullish view and suggests that investors should closely watch for a sustained breakout above $87.38 as a possible trigger for further gains.






Latest Omnicom Group News




-
 Afghanistan
-
 Albania
-
 Algeria
-
 Angola
-
 Argentina
-
 Armenia
-
 Australia
-
 Austria
-
 Azerbaijan
-
 Bahamas
-
 Bahrain
-
 Bangladesh
-
 Belarus
-
 Belgium
-
 Bolivia
-
 Botswana
-
 Brazil
-
 Brunei
-
 Bulgaria
-
 Cambodia
-
 Cameroon
-
 Canada
-
 Chile
-
 China
-
 Colombia
-
 Congo
-
 Costa Rica
-
 Cote d'Ivoire
-
 Croatia
-
 Cuba
-
 Cyprus
-
 Czechia
-
 DR Congo
-
 Denmark
-
 Dominican Republic
-
 Ecuador
-
 Egypt
-
 El Salvador
-
 Estonia
-
 Eswatini
-
 Ethiopia
-
 Finland
-
 France
-
 Georgia
-
 Germany
-
 Ghana
-
 Greece
-
 Haiti
-
 Hong Kong
-
 Hungary
-
 India
-
 Indonesia
-
 Iran, Islamic republic
-
 Iraq
-
 Ireland
-
 Israel
-
 Italy
-
 Jamaica
-
 Japan
-
 Jordan
-
 Kazakhstan
-
 Kenya
-
 Korea
-
 Kuwait
-
 Kyrgyzstan
-
 Laos
-
 Latvia
-
 Lebanon
-
 Lesotho
-
 Libya
-
 Lithuania
-
 Luxembourg
-
 Madagascar
-
 Malaysia
-
 Malta
-
 Mauritius
-
 Mexico
-
 Moldova
-
 Mongolia
-
 Montenegro
-
 Morocco
-
 Mozambique
-
 Myanmar
-
 Namibia
-
 Nepal
-
 Netherlands
-
 New Zealand
-
 Nigeria
-
 North Macedonia
-
 Norway
-
 Oman
-
 Pakistan
-
 Palestine
-
 Panama
-
 Papua New Guinea
-
 Paraguay
-
 Peru
-
 Philippines
-
 Poland
-
 Portugal
-
 Puerto Rico
-
 Qatar
-
 Reunion
-
 Romania
-
 Rwanda
-
 Saudi Arabia
-
 Serbia
-
 Singapore
-
 Slovakia
-
 Slovenia
-
 Somalia
-
 South Africa
-
 Spain
-
 Sri Lanka
-
 Sweden
-
 Switzerland
-
 Syria
-
 Taiwan
-
 Tajikistan
-
 Tanzania
-
 Thailand
-
 Trinidad and Tobago
-
 Tunisia
-
 Turkey
-
 UAE
-
 Uganda
-
 Ukraine
-
 United Kingdom
-
United States
-
 Uruguay
-
 Uzbekistan
-
 Venezuela
-
 Vietnam
-
 Yemen
-
 Zambia
-
 Zimbabwe
- Forex
- Crypto












