

What's behind Omnicom Group's latest 4.2% stock pullback?

Omnicom Group Inc. (OMC) dropped 4.2% today as a wave of sustained selling pressure triggered a sharp move lower. The decline is reinforced by the stock sinking below its short-, medium-, and long-term moving averages, with technical momentum and negative oscillators supporting the bearish tone.
 82.35
81.82
Highlights
- Shares of Omnicom Group fell 4.2% to $77.72, closing near the session low after a downside gap.
- The stock trades below key short-, medium-, and long-term moving averages, with technicals indicating broad seller control and oversold signals.
- Expect Omnicom Group stock to move between $75.58 and $79.86 in the next five days, with a 52% chance of further decline.
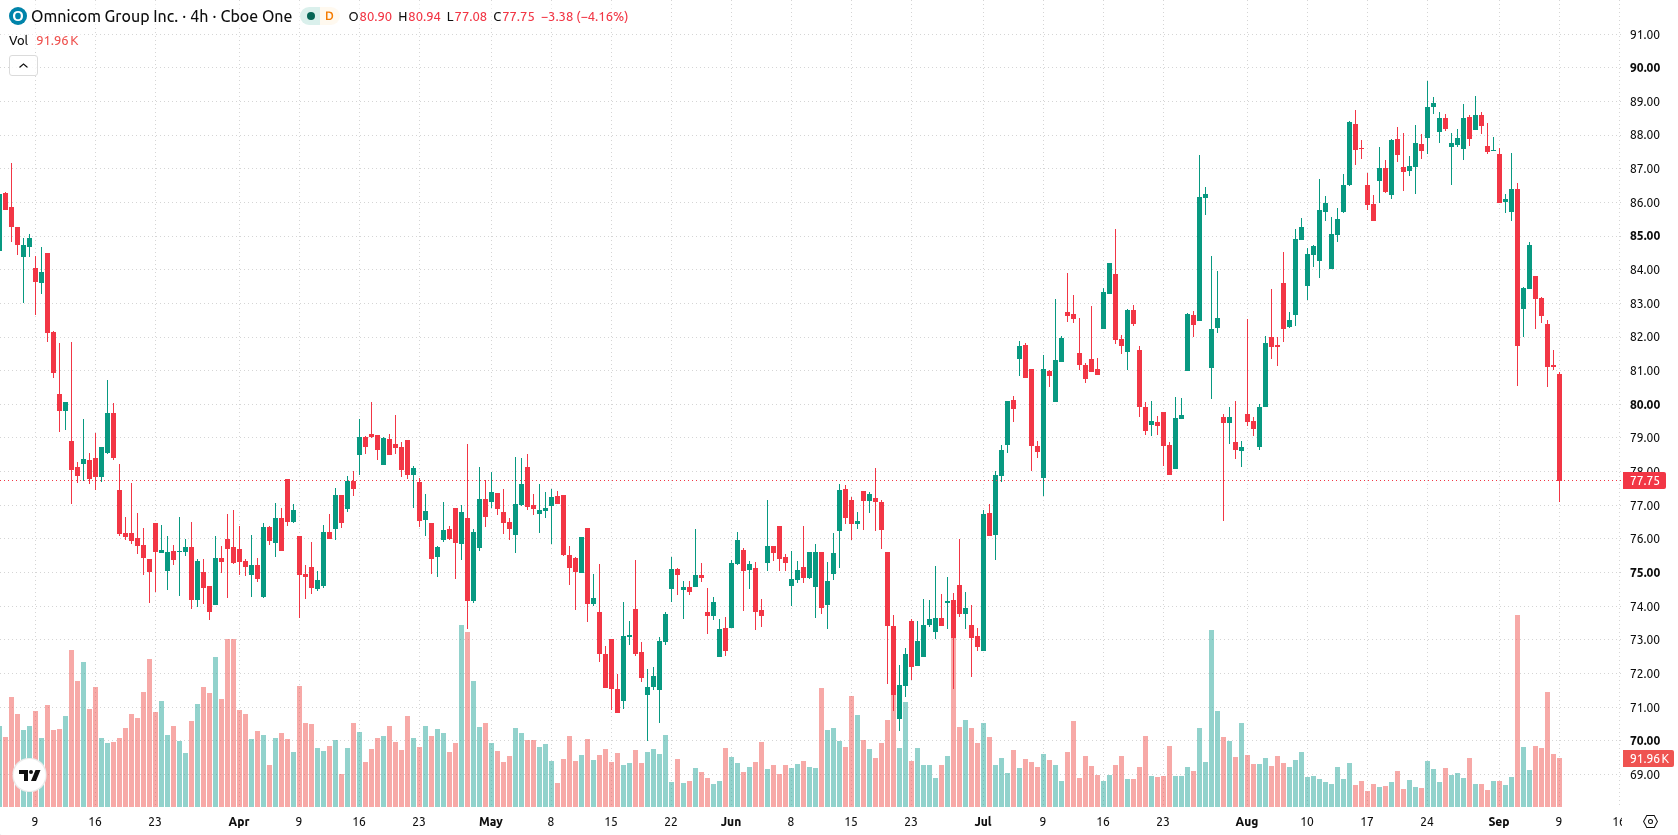
Technical sell signals intensify as Omnicom tests key support
Omnicom Group is trading below the $86.31 (MA-20), $82.86 (MA-50), and $78.07 (MA-200) moving averages, which points to negative momentum across all time frames. The immediate resistance is near the $78.07 MA-200, with the session's low at $77.67 acting as support and underlining intensified downside pressure. The MACD is neutral, but overall momentum signals are biased to the downside: RSI is at 41.1 with a sell tilt, CCI and Stochastic RSI are both oversold, and BBP at -2.56 signals strong seller dominance. The Awesome Oscillator is also giving a strong sell signal, consistent with the current downtrend.
Earlier, analysts noted that Omnicom Group exhibited strong bullish momentum, supported by sustained gains and constructive technical signals. The current move below major moving averages and confirmation of broad-based downside momentum marks a notable shift, with traders advised to watch $77.67 as a pivotal support level for potential further weakness.






Latest Omnicom Group News




-
 Afghanistan
-
 Albania
-
 Algeria
-
 Angola
-
 Argentina
-
 Armenia
-
 Australia
-
 Austria
-
 Azerbaijan
-
 Bahamas
-
 Bahrain
-
 Bangladesh
-
 Belarus
-
 Belgium
-
 Bolivia
-
 Botswana
-
 Brazil
-
 Brunei
-
 Bulgaria
-
 Cambodia
-
 Cameroon
-
 Canada
-
 Chile
-
 China
-
 Colombia
-
 Congo
-
 Costa Rica
-
 Cote d'Ivoire
-
 Croatia
-
 Cuba
-
 Cyprus
-
 Czechia
-
 DR Congo
-
 Denmark
-
 Dominican Republic
-
 Ecuador
-
 Egypt
-
 El Salvador
-
 Estonia
-
 Eswatini
-
 Ethiopia
-
 Finland
-
 France
-
 Georgia
-
 Germany
-
 Ghana
-
 Greece
-
 Haiti
-
 Hong Kong
-
 Hungary
-
 India
-
 Indonesia
-
 Iran, Islamic republic
-
 Iraq
-
 Ireland
-
 Israel
-
 Italy
-
 Jamaica
-
 Japan
-
 Jordan
-
 Kazakhstan
-
 Kenya
-
 Korea
-
 Kuwait
-
 Kyrgyzstan
-
 Laos
-
 Latvia
-
 Lebanon
-
 Lesotho
-
 Libya
-
 Lithuania
-
 Luxembourg
-
 Madagascar
-
 Malaysia
-
 Malta
-
 Mauritius
-
 Mexico
-
 Moldova
-
 Mongolia
-
 Montenegro
-
 Morocco
-
 Mozambique
-
 Myanmar
-
 Namibia
-
 Nepal
-
 Netherlands
-
 New Zealand
-
 Nigeria
-
 North Macedonia
-
 Norway
-
 Oman
-
 Pakistan
-
 Palestine
-
 Panama
-
 Papua New Guinea
-
 Paraguay
-
 Peru
-
 Philippines
-
 Poland
-
 Portugal
-
 Puerto Rico
-
 Qatar
-
 Reunion
-
 Romania
-
 Rwanda
-
 Saudi Arabia
-
 Serbia
-
 Singapore
-
 Slovakia
-
 Slovenia
-
 Somalia
-
 South Africa
-
 Spain
-
 Sri Lanka
-
 Sweden
-
 Switzerland
-
 Syria
-
 Taiwan
-
 Tajikistan
-
 Tanzania
-
 Thailand
-
 Trinidad and Tobago
-
 Tunisia
-
 Turkey
-
 UAE
-
 Uganda
-
 Ukraine
-
 United Kingdom
-
United States
-
 Uruguay
-
 Uzbekistan
-
 Venezuela
-
 Vietnam
-
 Yemen
-
 Zambia
-
 Zimbabwe
- Forex
- Crypto












