

Mondelez shares technical analysis: Rally challenges $65.21 resistance

Mondelez International (MDLZ) stock is trading at $62.44, posting a daily gain of 2.97%. The price sits above its key moving averages, reflecting positive momentum across short-, medium-, and long-term timeframes.
 67.60
67.60
Highlights
- Mondelez International’s Q2 2026 earnings report on July 28 is drawing increased investor scrutiny, reflecting heightened interest in revenue and operational performance.
- The company leveraged AI-driven process improvements with Celonis to recover over $10 million, supporting sustained efficiency and stock momentum.
- MDLZ maintains a bullish technical setup with strong momentum indicators, likely trading in a $61.72–$65.21 range barring a break of key support.
Anticipation grows as earnings approach and AI gains materialize
Investor focus remains on Mondelez International's upcoming Q2 2026 earnings report, scheduled after market close on July 28, 2026, as noted by Stockstory. The approaching earnings release heightens interest in the stock, driving anticipation about revenue trends and operational performance. In addition, Mondelez has demonstrated measurable benefits from its partnership with Celonis, having recovered over $10 million in value through enterprise AI initiatives over the past 18 months, which underpins long-term efficiency improvements and supports momentum in the stock.
Buy signals dominate as price tests upper technical limits
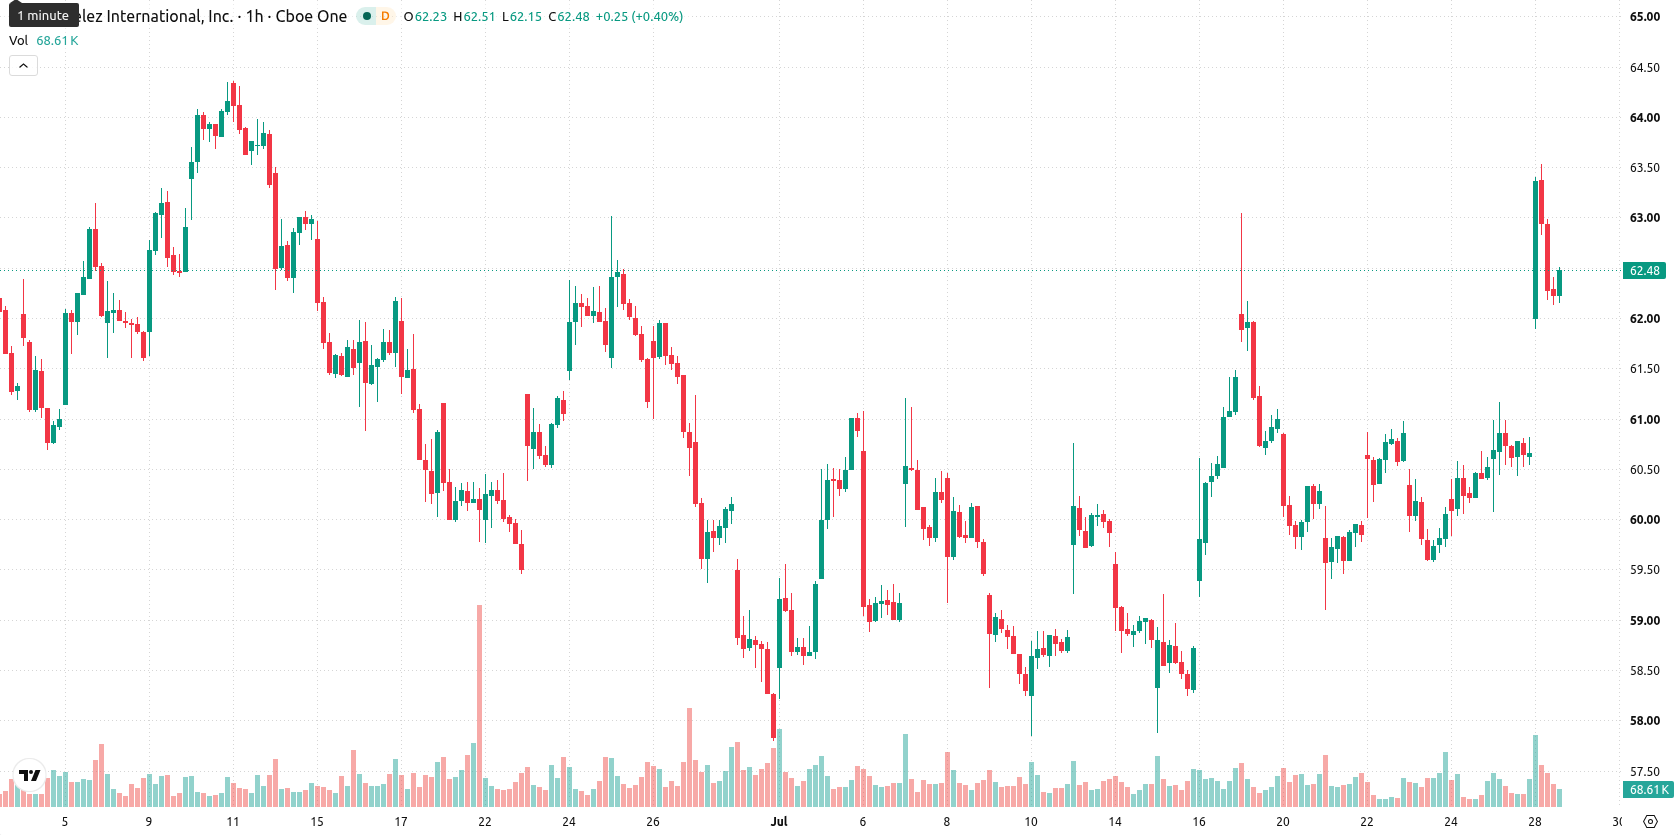
On the technical front, MDLZ is trading above the MA-20 ($61.02) and MA-50 ($60.52) on the hourly chart, while remaining well above the MA-200 ($58.6) on the daily chart. The Ichimoku Kijun level at $61.56 currently serves as immediate support. MACD and ADX both indicate a buy, with the Awesome Oscillator also supporting further upside. RSI flashes a buy signal, but both CCI and Bull/Bear Power are in overbought territory, and Stoch RSI stands neutral. The price activity featured a 2.01% gap up but closed near the session low, suggesting heightened volatility and a degree of caution despite intraday buyer dominance according to Bull/Bear Power.
Price consolidation expected as volatility defines near-term range
In the short term, MDLZ is expected to consolidate within the $61.72–$65.21 range, representing a typical volatility band relative to current levels. The baseline scenario sees the price holding within this corridor. A break above $65.21 could trigger a fresh upward extension, while a move below $61.56 support would challenge the prevailing trend and prompt a more cautious stance.
Earlier, analysts noted that Mondelez’s technical outlook was underpinned by strong momentum but tempered by overbought signals and the risk of sideways consolidation. The arrival of new catalysts—namely heightened earnings anticipation and operational gains from AI-driven efficiencies—adds a constructive dimension, making the forthcoming Q2 2026 report a pivotal event for traders monitoring a potential breakout above the current consolidation zone.






Latest Mondelez News





-
 Afghanistan
-
 Albania
-
 Algeria
-
 Angola
-
 Argentina
-
 Armenia
-
 Australia
-
 Austria
-
 Azerbaijan
-
 Bahamas
-
 Bahrain
-
 Bangladesh
-
 Belarus
-
 Belgium
-
 Bolivia
-
 Botswana
-
 Brazil
-
 Brunei
-
 Bulgaria
-
 Cambodia
-
 Cameroon
-
 Canada
-
 Chile
-
 China
-
 Colombia
-
 Congo
-
 Costa Rica
-
 Cote d'Ivoire
-
 Croatia
-
 Cuba
-
 Cyprus
-
 Czechia
-
 DR Congo
-
 Denmark
-
 Dominican Republic
-
 Ecuador
-
 Egypt
-
 El Salvador
-
 Estonia
-
 Eswatini
-
 Ethiopia
-
 Finland
-
 France
-
 Georgia
-
 Germany
-
 Ghana
-
 Greece
-
 Haiti
-
 Hong Kong
-
 Hungary
-
 India
-
 Indonesia
-
 Iran, Islamic republic
-
 Iraq
-
 Ireland
-
 Israel
-
 Italy
-
 Jamaica
-
 Japan
-
 Jordan
-
 Kazakhstan
-
 Kenya
-
 Korea
-
 Kuwait
-
 Kyrgyzstan
-
 Laos
-
 Latvia
-
 Lebanon
-
 Lesotho
-
 Libya
-
 Lithuania
-
 Luxembourg
-
 Madagascar
-
 Malaysia
-
 Malta
-
 Mauritius
-
 Mexico
-
 Moldova
-
 Mongolia
-
 Montenegro
-
 Morocco
-
 Mozambique
-
 Myanmar
-
 Namibia
-
 Nepal
-
 Netherlands
-
 New Zealand
-
 Nigeria
-
 North Macedonia
-
 Norway
-
 Oman
-
 Pakistan
-
 Palestine
-
 Panama
-
 Papua New Guinea
-
 Paraguay
-
 Peru
-
 Philippines
-
 Poland
-
 Portugal
-
 Puerto Rico
-
 Qatar
-
 Reunion
-
 Romania
-
 Rwanda
-
 Saudi Arabia
-
 Serbia
-
 Singapore
-
 Slovakia
-
 Slovenia
-
 Somalia
-
 South Africa
-
 Spain
-
 Sri Lanka
-
 Sweden
-
 Switzerland
-
 Syria
-
 Taiwan
-
 Tajikistan
-
 Tanzania
-
 Thailand
-
 Trinidad and Tobago
-
 Tunisia
-
 Turkey
-
 UAE
-
 Uganda
-
 Ukraine
-
 United Kingdom
-
United States
-
 Uruguay
-
 Uzbekistan
-
 Venezuela
-
 Vietnam
-
 Yemen
-
 Zambia
-
 Zimbabwe
- Forex
- Crypto












