

Record leasing activity in CoreSite data centers: Can American Tower stock extend gains?

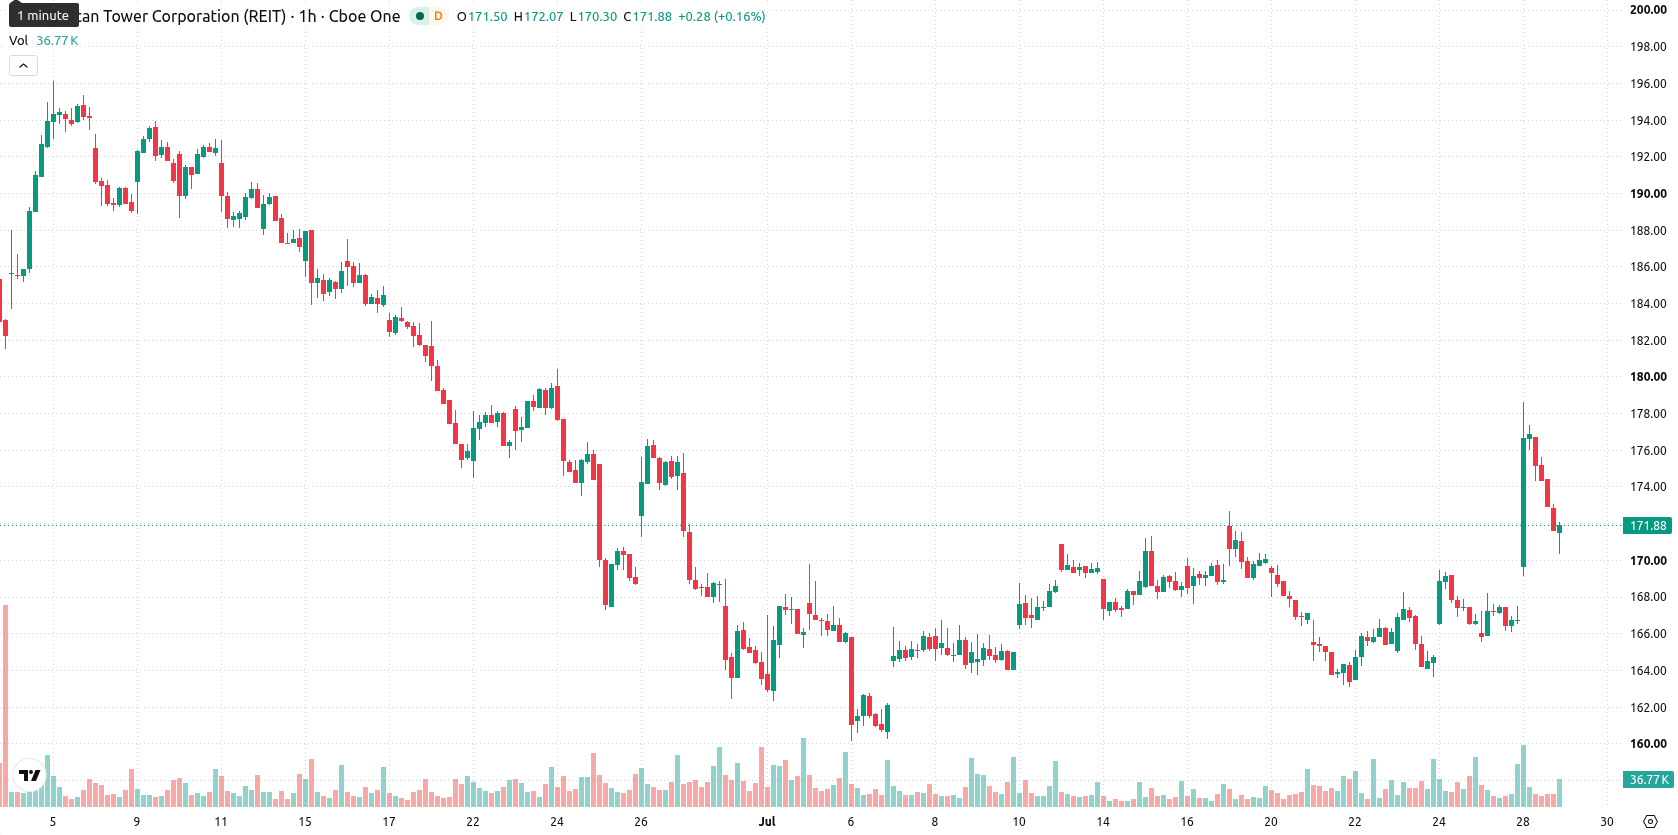
American Tower (AMT) stock is trading at $171.7, advancing 2.97% on the day. The price stands above its key short-term moving averages, signaling near-term momentum, but remains below the long-term trend indicator.
 185.88
185.88
185.88
Highlights
- American Tower beat second-quarter 2026 GAAP EPS expectations by 17.7%, showcasing strong earnings momentum.
- Robust leasing and record CoreSite data center activity drove revenue up to $2.75 billion, supporting positive operational trends.
- Technical outlook projects a $166.4–$174.38 range, with near-term bullish momentum amid broader volatility and uncertain trend strength.
Operational strength as tower demand and buyback plans boost sentiment
American Tower’s latest earnings saw GAAP earnings per share for the second quarter of 2026 beat expectations by 17.7%, while adjusted funds from operations matched the consensus, highlighting strong operational performance. The company also reported quarterly revenue growth to $2.75 billion, driven by robust tower leasing and record activity in its CoreSite data center segment, which supports broad-based demand across core business lines. Additionally, management’s decision to continue prioritizing shareholder returns—including dividends and a substantial $1.4 billion remaining under the buyback program—further reinforces upward momentum in value perception.
Upside capped by MA-200 as mixed oscillators indicate seller persistence
Technically, AMT is trading above the MA-20 at $169.57 and MA-50 at $167.52 on the hourly chart, while it remains capped by the MA-200 at $179.17 on the daily timeframe. The Ichimoku Kijun line at $171.09 is acting as immediate support. MACD is signaling a buy, ADX reads as neutral, and RSI holds at a moderately bullish level of 55.42. In contrast, Stochastic RSI, CCI, and Awesome Oscillator are neutral, and Bull/Bear Power is classified as oversold, suggesting intraday seller dominance despite the daily move higher. The session experienced a 2.87 gap alongside high volatility, with price holding near the session’s low as conflicting oscillator signals reflect the ongoing battle between buyers and sellers.
Consolidation likely as volatility shapes bullish breakout risks
Over the next 2–3 trading days, the price is expected to move within a sideways corridor, with an anticipated range of $166.4 to $174.38 based on typical volatility. The most probable scenario is consolidation between these levels, with a 78% likelihood of further upward movement and only a 22% chance of a downside break. A decisive breach above resistance could trigger a bullish move, while falling below immediate support at the Kijun or the lower end of the expected range would tip the scenario bearish.
Earlier, analysts noted that airlines faced mounting cost pressures and potential instability as energy prices surged, prompting concerns over the financial resilience of related sectors. In contrast, American Tower’s robust operational performance and strong shareholder return initiatives highlight relative stability, with the current focus on the $174.38 resistance as the critical upside inflection point for traders monitoring renewed momentum.











-
 Afghanistan
-
 Albania
-
 Algeria
-
 Angola
-
 Argentina
-
 Armenia
-
 Australia
-
 Austria
-
 Azerbaijan
-
 Bahamas
-
 Bahrain
-
 Bangladesh
-
 Belarus
-
 Belgium
-
 Bolivia
-
 Botswana
-
 Brazil
-
 Brunei
-
 Bulgaria
-
 Cambodia
-
 Cameroon
-
 Canada
-
 Chile
Chile
-
 China
China
-
 Colombia
-
 Congo
Congo
-
 Costa Rica
-
 Cote d'Ivoire
-
 Croatia
-
 Cuba
Cuba
-
 Cyprus
-
 Czechia
-
 DR Congo
-
 Denmark
-
 Dominican Republic
-
 Ecuador
-
 Egypt
Egypt
-
 El Salvador
-
 Estonia
-
 Eswatini
-
 Ethiopia
-
 Finland
-
 France
-
 Georgia
-
 Germany
-
 Ghana
Ghana
-
 Greece
-
 Haiti
Haiti
-
 Hong Kong
-
 Hungary
-
 India
India
-
 Indonesia
-
 Iran, Islamic republic
-
 Iraq
Iraq
-
 Ireland
-
 Israel
-
 Italy
Italy
-
 Jamaica
-
 Japan
Japan
-
 Jordan
-
 Kazakhstan
-
 Kenya
Kenya
-
 Korea
Korea
-
 Kuwait
-
 Kyrgyzstan
-
 Laos
Laos
-
 Latvia
-
 Lebanon
-
 Lesotho
-
 Libya
Libya
-
 Lithuania
-
 Luxembourg
-
 Madagascar
-
 Malaysia
-
 Malta
Malta
-
 Mauritius
-
 Mexico
-
 Moldova
-
 Mongolia
-
 Montenegro
-
 Morocco
-
 Mozambique
-
 Myanmar
-
 Namibia
-
 Nepal
Nepal
-
 Netherlands
-
 New Zealand
-
 Nigeria
-
 North Macedonia
-
 Norway
-
 Oman
Oman
-
 Pakistan
-
 Palestine
-
 Panama
-
 Papua New Guinea
-
 Paraguay
-
 Peru
Peru
-
 Philippines
-
 Poland
-
 Portugal
-
 Puerto Rico
-
 Qatar
Qatar
-
 Reunion
-
 Romania
-
 Rwanda
-
 Saudi Arabia
-
 Serbia
-
 Singapore
-
 Slovakia
-
 Slovenia
-
 Somalia
-
 South Africa
-
 Spain
Spain
-
 Sri Lanka
-
 Sweden
-
 Switzerland
-
 Syria
Syria
-
 Taiwan
-
 Tajikistan
-
 Tanzania
-
 Thailand
-
 Trinidad and Tobago
-
 Tunisia
-
 Turkey
-
 UAE
UAE
-
 Uganda
-
 Ukraine
-
 United Kingdom
-
United States
-
 Uruguay
-
 Uzbekistan
-
 Venezuela
-
 Vietnam
-
 Yemen
Yemen
-
 Zambia
-
 Zimbabwe
- Forex
- Crypto












