

Will American Tower stock avoid deeper losses amid mixed momentum signals?

American Tower (AMT) stock is trading at $182.18 after a daily decline of 3.24%. The price now sits below its key moving averages on the hourly chart, reflecting short-term selling pressure while remaining above longer-term trend levels.
 189.99
191.10
Highlights
- American Tower reported third quarter 2026 adjusted funds from operations per share of $2.87, exceeding market expectations.
- Revenue reached $2.79 billion with net income of $780.8 million, and the company repurchased 1.8 million shares for $315 million.
- Shares of American Tower trade below key short- and medium-term moving averages, with price expected in a $171.64 to $192.72 range amid directionless momentum signals.
Earnings beat and share buyback fail to offset broad selling
American Tower reported adjusted funds from operations (AFFO) per share of $2.87 for the third quarter of 2026, surpassing market expectations according to Yahoo Finance. The company also posted revenue of approximately $2.79 billion and net income of $780.8 million for the same period, confirming the ongoing earning power of its tower and data center business. In addition, American Tower completed the repurchase of 1.8 million shares at a total cost of $315 million during the quarter, as reported by News Alphastreet, though price action has remained under broader selling pressure.
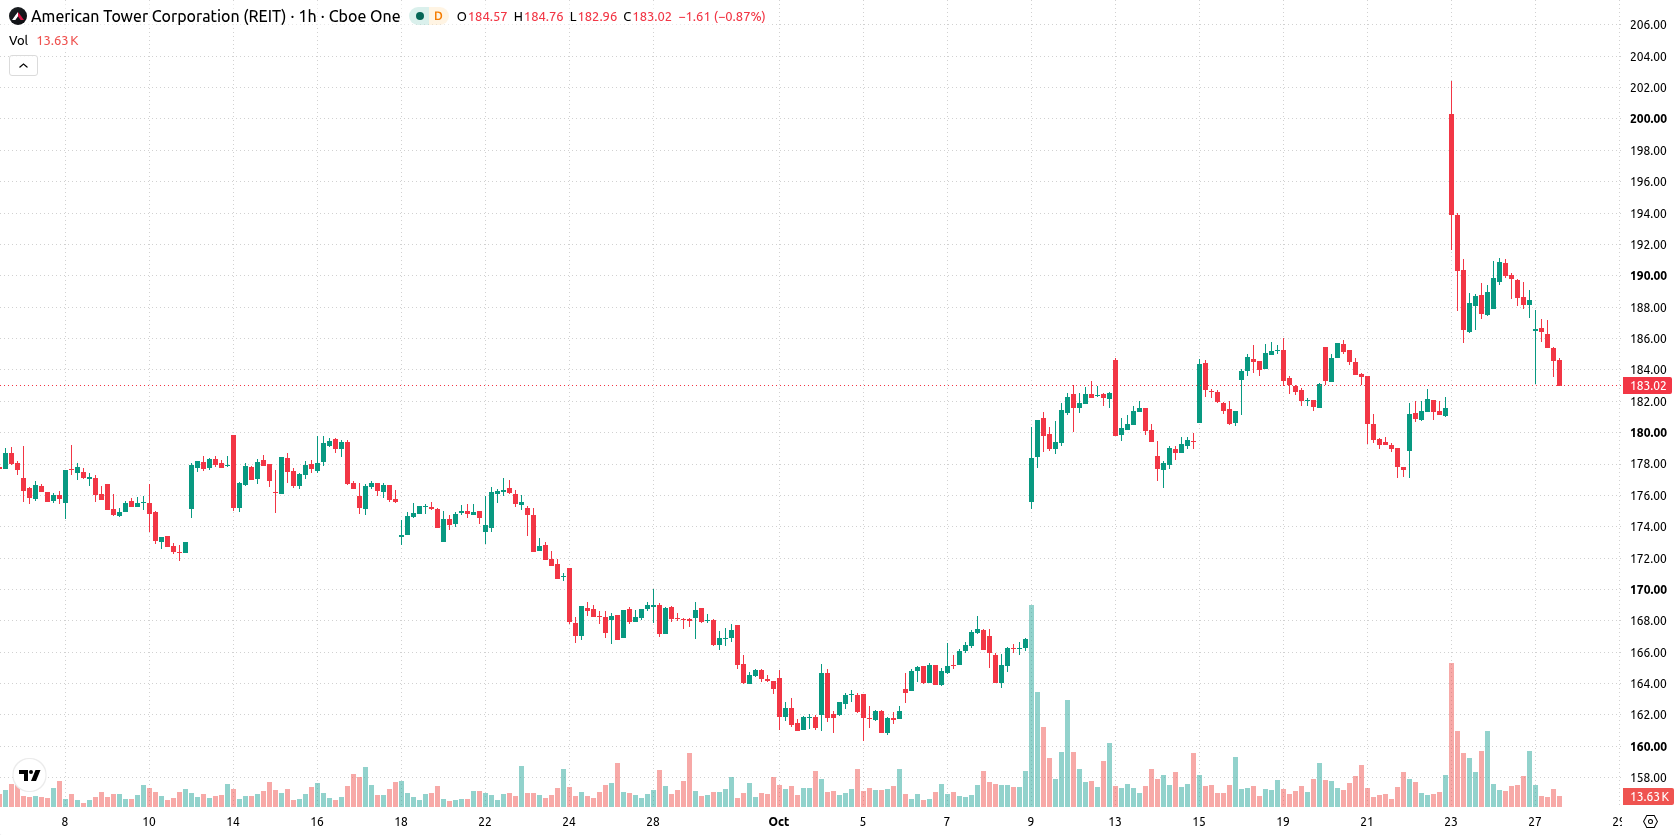
Mixed momentum as hourly resistance holds amid diverging signals
On the hourly timeframe, AMT is trading below both the MA-20 at $187.24 and the MA-50 at $184.43, while staying above the MA-200 at $177.17. The Ichimoku Kijun line at $187.01 acts as immediate resistance. Momentum indicators are mixed: MACD shows a strong buy, while ADX indicates sellers are still in control. RSI stands at 52.69 and gives a buy signal, but Stochastic RSI and Bull/Bear Power both point to oversold conditions; the CCI is neutral. Price closed near its intraday lows after a session marked by a moderate gap down, underlining persistent weakness not fully reflected across all indicators. The combination of diverging oscillator and momentum readings signals a lack of clear direction.
Even odds for breakout or drop as price consolidates
In the short term, AMT is expected to move within a range between $171.64 and $192.72. Probabilities for upward and downward moves are evenly balanced at 50% each, implying neutral directional bias. The baseline scenario anticipates price consolidation within this sideways corridor. A breakout above resistance at $187.01 would indicate renewed bullish momentum, while a drop below the $171.64 support level could trigger further downside.
Previously it was reported that American Tower's technical outlook was bullish, supported by anticipated tower demand and encouraging insider activity. The current analysis, however, highlights increased short-term selling pressure and a neutral bias, with a decisive move above $187.01 or below $171.64 likely to determine the next direction.






Latest American Tower News




-
 Afghanistan
-
 Albania
-
 Algeria
-
 Angola
-
 Argentina
-
 Armenia
-
 Australia
-
 Austria
-
 Azerbaijan
-
 Bahamas
-
 Bahrain
-
 Bangladesh
-
 Belarus
-
 Belgium
-
 Bolivia
-
 Botswana
-
 Brazil
-
 Brunei
-
 Bulgaria
-
 Cambodia
-
 Cameroon
-
 Canada
-
 Chile
-
 China
-
 Colombia
-
 Congo
-
 Costa Rica
-
 Cote d'Ivoire
-
 Croatia
-
 Cuba
-
 Cyprus
-
 Czechia
-
 DR Congo
-
 Denmark
-
 Dominican Republic
-
 Ecuador
-
 Egypt
-
 El Salvador
-
 Estonia
-
 Eswatini
-
 Ethiopia
-
 Finland
-
 France
-
 Georgia
-
 Germany
-
 Ghana
-
 Greece
-
 Haiti
-
 Hong Kong
-
 Hungary
-
 India
-
 Indonesia
-
 Iran, Islamic republic
-
 Iraq
-
 Ireland
-
 Israel
-
 Italy
-
 Jamaica
-
 Japan
-
 Jordan
-
 Kazakhstan
-
 Kenya
-
 Korea
-
 Kuwait
-
 Kyrgyzstan
-
 Laos
-
 Latvia
-
 Lebanon
-
 Lesotho
-
 Libya
-
 Lithuania
-
 Luxembourg
-
 Madagascar
-
 Malaysia
-
 Malta
-
 Mauritius
-
 Mexico
-
 Moldova
-
 Mongolia
-
 Montenegro
-
 Morocco
-
 Mozambique
-
 Myanmar
-
 Namibia
-
 Nepal
-
 Netherlands
-
 New Zealand
-
 Nigeria
-
 North Macedonia
-
 Norway
-
 Oman
-
 Pakistan
-
 Palestine
-
 Panama
-
 Papua New Guinea
-
 Paraguay
-
 Peru
-
 Philippines
-
 Poland
-
 Portugal
-
 Puerto Rico
-
 Qatar
-
 Reunion
-
 Romania
-
 Rwanda
-
 Saudi Arabia
-
 Serbia
-
 Singapore
-
 Slovakia
-
 Slovenia
-
 Somalia
-
 South Africa
-
 Spain
-
 Sri Lanka
-
 Sweden
-
 Switzerland
-
 Syria
-
 Taiwan
-
 Tajikistan
-
 Tanzania
-
 Thailand
-
 Trinidad and Tobago
-
 Tunisia
-
 Turkey
-
 UAE
-
 Uganda
-
 Ukraine
-
 United Kingdom
-
United States
-
 Uruguay
-
 Uzbekistan
-
 Venezuela
-
 Vietnam
-
 Yemen
-
 Zambia
-
 Zimbabwe
- Forex
- Crypto












