

BROS falls as sellers keep control and weak momentum weighs on price

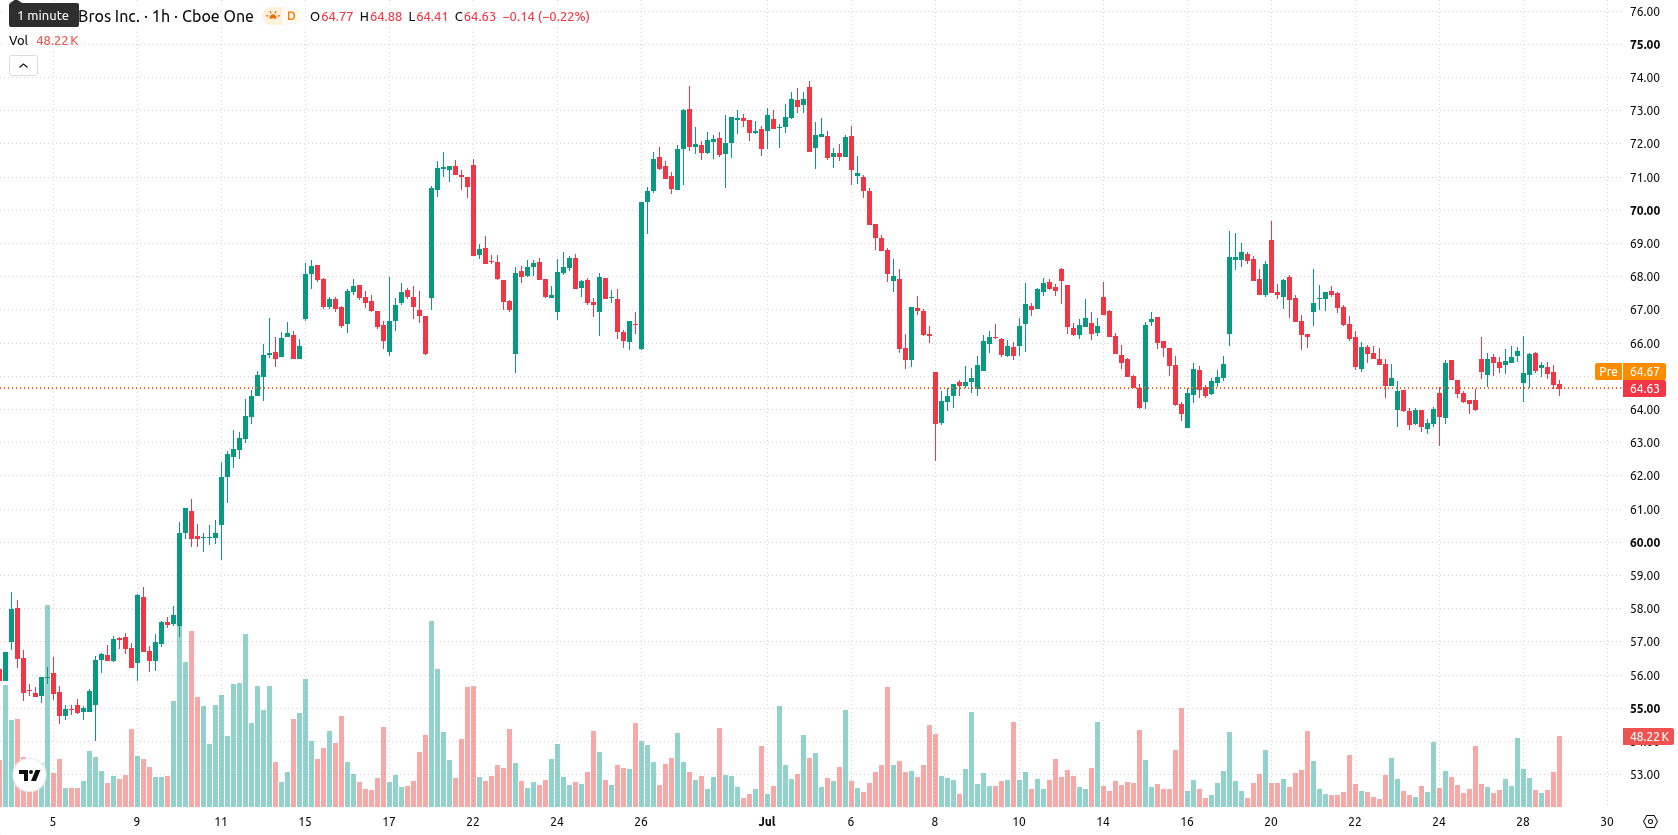
Dutch Bros (BROS) stock is trading at $64.67 after slipping 1.57% today and remains below its key short- and medium-term moving averages, though it is still supported by longer-term trend levels.
 36.00
36.52
Highlights
- BROS/USD faces continued short- and medium-term selling pressure, trading below key short-term moving averages after a volatile session.
- Momentum indicators overwhelmingly signal a bearish outlook, with MACD, RSI, CCI, and other tools highlighting strong near-term seller dominance.
- Expect BROS/USD to trade sideways between $63.14 and $66.20 in the coming days, with downside risk significantly outweighing the probability of an upside breakout.
Bearish momentum confirmed as neutral signals create near-term tension
On the hourly chart, BROS/USD is trading below its MA-20 ($65.04) and MA-50 ($65.52), while the daily MA-200 at $57.46 still acts as major support. The Ichimoku Kijun is providing an additional support level at $64.55. Momentum signals are predominately negative: the MACD and RSI (45.05) confirm a bearish bias, and both Stoch RSI and Bull/Bear Power show oversold conditions and prevailing seller dominance. The CCI further supports this sell-side stance, while both ADX and the Awesome Oscillator remain neutral, suggesting some divergence within short-term momentum readings.
Sideways bias favored as bearish setup limits bullish break
In the near term, BROS is likely to trade within a volatility band of $63.14 to $66.2. Upside potential appears limited, with downside scenarios more probable based on the current technical and momentum setup. The most likely baseline is sideways activity within this range; a bullish breakout would require clearing resistance, while further declines could accelerate if immediate support is breached.
Earlier, analysts noted that Dutch Bros stock was supported by increased institutional activity, with technical signals suggesting a cautiously optimistic outlook. The current environment, however, signals a shift toward prevailing downside risk, making a break below the $63.14 support level a critical threshold to monitor for potential further weakness.






Latest Dutch Bros News







-
 Afghanistan
-
 Albania
-
 Algeria
-
 Angola
-
 Argentina
-
 Armenia
-
 Australia
-
 Austria
-
 Azerbaijan
-
 Bahamas
-
 Bahrain
-
 Bangladesh
-
 Belarus
-
 Belgium
-
 Bolivia
-
 Botswana
-
 Brazil
-
 Brunei
-
 Bulgaria
-
 Cambodia
-
 Cameroon
-
 Canada
-
 Chile
-
 China
-
 Colombia
-
 Congo
-
 Costa Rica
-
 Cote d'Ivoire
-
 Croatia
-
 Cuba
-
 Cyprus
-
 Czechia
-
 DR Congo
-
 Denmark
-
 Dominican Republic
-
 Ecuador
-
 Egypt
-
 El Salvador
-
 Estonia
-
 Eswatini
-
 Ethiopia
-
 Finland
-
 France
-
 Georgia
-
 Germany
-
 Ghana
-
 Greece
-
 Haiti
-
 Hong Kong
-
 Hungary
-
 India
-
 Indonesia
-
 Iran, Islamic republic
-
 Iraq
-
 Ireland
-
 Israel
-
 Italy
-
 Jamaica
-
 Japan
-
 Jordan
-
 Kazakhstan
-
 Kenya
-
 Korea
-
 Kuwait
-
 Kyrgyzstan
-
 Laos
-
 Latvia
-
 Lebanon
-
 Lesotho
-
 Libya
-
 Lithuania
-
 Luxembourg
-
 Madagascar
-
 Malaysia
-
 Malta
-
 Mauritius
-
 Mexico
-
 Moldova
-
 Mongolia
-
 Montenegro
-
 Morocco
-
 Mozambique
-
 Myanmar
-
 Namibia
-
 Nepal
-
 Netherlands
-
 New Zealand
-
 Nigeria
-
 North Macedonia
-
 Norway
-
 Oman
-
 Pakistan
-
 Palestine
-
 Panama
-
 Papua New Guinea
-
 Paraguay
-
 Peru
-
 Philippines
-
 Poland
-
 Portugal
-
 Puerto Rico
-
 Qatar
-
 Reunion
-
 Romania
-
 Rwanda
-
 Saudi Arabia
-
 Serbia
-
 Singapore
-
 Slovakia
-
 Slovenia
-
 Somalia
-
 South Africa
-
 Spain
-
 Sri Lanka
-
 Sweden
-
 Switzerland
-
 Syria
-
 Taiwan
-
 Tajikistan
-
 Tanzania
-
 Thailand
-
 Trinidad and Tobago
-
 Tunisia
-
 Turkey
-
 UAE
-
 Uganda
-
 Ukraine
-
 United Kingdom
-
United States
-
 Uruguay
-
 Uzbekistan
-
 Venezuela
-
 Vietnam
-
 Yemen
-
 Zambia
-
 Zimbabwe
- Forex
- Crypto












