

What's behind Textron's latest 4.8% stock pullback?

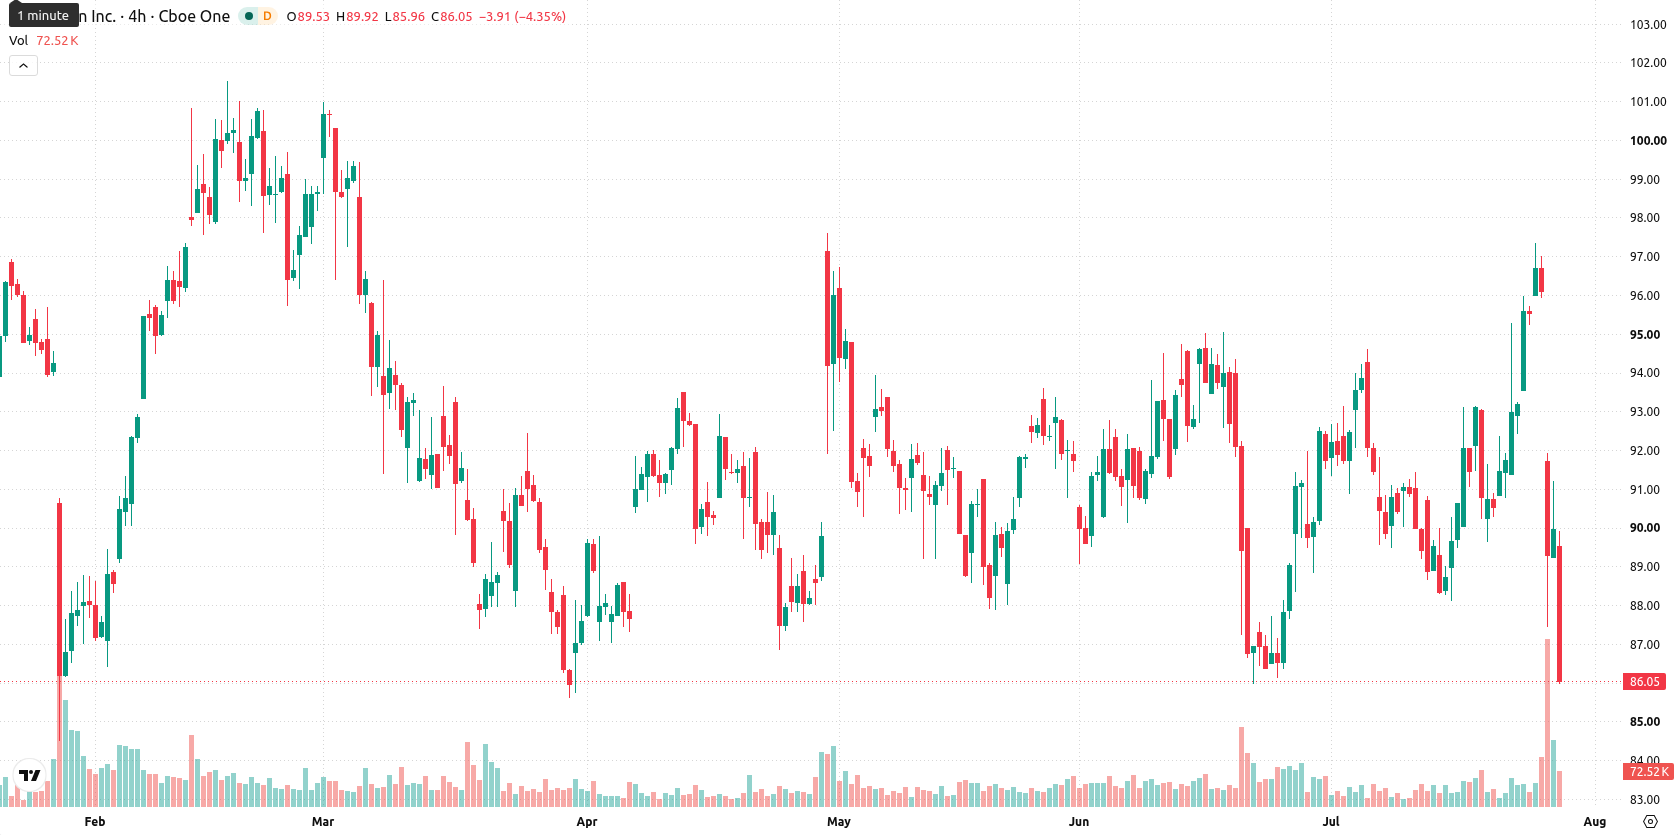
Textron Inc (TXT) fell 4.84% following the release of its second-quarter 2026 earnings, as the company reaffirmed its full-year EPS guidance and highlighted potential funding issues for a key defense program. The extent of the decline is supported by Textron trading below its 20-day, 50-day, and 200-day moving averages, highlighting persistent selling pressure across all timeframes.
 89.86
78.53
Highlights
- Textron reported Q2 2026 revenue of $3.83 billion and adjusted EPS of $1.62, beating consensus expectations.
- Management reaffirmed full-year EPS guidance of $6.40 to $6.60, with risks tied to MV-75 Cheyenne program funding and ongoing plans to exit the Industrial segment.
- Shares trade below key moving averages with pronounced selling pressure, a forecasted $80.51–$90.72 trading range, and 70% probability of further downside.
Revenue beat and buybacks offset by MV-75 funding concerns
Textron Inc. reported second-quarter 2026 revenue of $3.83 billion, a 3% year-over-year increase, and adjusted EPS of $1.62, which exceeded consensus estimates. The company reaffirmed its full-year EPS guidance of $6.40 to $6.60 and noted possible downside if additional government funding for the MV-75 Cheyenne program is not obtained. Textron continued to pursue the sale or separation of its Industrial segment to focus on aerospace and defense, and returned $209 million to shareholders through share repurchases, though price action has remained under broader selling pressure.
Mixed momentum signals as price breaks key moving averages
Textron trades below its 20-day ($91.52), 50-day ($91.11), and 200-day ($89.53) moving averages, indicating ongoing seller pressure across short, medium, and long-term trends. This price setup aligns with a bullish long-term trend structure, but the near-term ceiling is now at $85.65 with immediate downside room toward the near-term floor at $80.51. Momentum readings are mixed: the MACD signals a buy, yet the ADX shows a weak and neutral trend. Both the RSI at 46.08 and CCI at -97.48 point to sell signals, with the Stochastic RSI showing deep oversold conditions at 11.65. Bull/Bear Power at -0.77 also confirms seller dominance intraday and points to oversold conditions. The stock is sharply lower on the session and has experienced heightened intraday volatility at 4.31%. Selling pressure after the open is reinforced by most momentum and oscillator readings except for MACD, which contradicts the dominant bearish tone.
Earlier, analysts noted rising regulatory and data quality pressures across key financial and industrial sectors, emphasizing the operational challenges faced by firms with complex reporting or compliance needs. Textron's recent price weakness amid funding concerns and shifting segment priorities adds a layer of sector-specific risk, with traders now focused on whether the stock sustains support above $80.51 in the coming sessions.






Latest Textron Inc News





-
 Afghanistan
-
 Albania
-
 Algeria
-
 Angola
-
 Argentina
-
 Armenia
-
 Australia
-
 Austria
-
 Azerbaijan
-
 Bahamas
-
 Bahrain
-
 Bangladesh
-
 Belarus
-
 Belgium
-
 Bolivia
-
 Botswana
-
 Brazil
-
 Brunei
-
 Bulgaria
-
 Cambodia
-
 Cameroon
-
 Canada
-
 Chile
-
 China
-
 Colombia
-
 Congo
-
 Costa Rica
-
 Cote d'Ivoire
-
 Croatia
-
 Cuba
-
 Cyprus
-
 Czechia
-
 DR Congo
-
 Denmark
-
 Dominican Republic
-
 Ecuador
-
 Egypt
-
 El Salvador
-
 Estonia
-
 Eswatini
-
 Ethiopia
-
 Finland
-
 France
-
 Georgia
-
 Germany
-
 Ghana
-
 Greece
-
 Haiti
-
 Hong Kong
-
 Hungary
-
 India
-
 Indonesia
-
 Iran, Islamic republic
-
 Iraq
-
 Ireland
-
 Israel
-
 Italy
-
 Jamaica
-
 Japan
-
 Jordan
-
 Kazakhstan
-
 Kenya
-
 Korea
-
 Kuwait
-
 Kyrgyzstan
-
 Laos
-
 Latvia
-
 Lebanon
-
 Lesotho
-
 Libya
-
 Lithuania
-
 Luxembourg
-
 Madagascar
-
 Malaysia
-
 Malta
-
 Mauritius
-
 Mexico
-
 Moldova
-
 Mongolia
-
 Montenegro
-
 Morocco
-
 Mozambique
-
 Myanmar
-
 Namibia
-
 Nepal
-
 Netherlands
-
 New Zealand
-
 Nigeria
-
 North Macedonia
-
 Norway
-
 Oman
-
 Pakistan
-
 Palestine
-
 Panama
-
 Papua New Guinea
-
 Paraguay
-
 Peru
-
 Philippines
-
 Poland
-
 Portugal
-
 Puerto Rico
-
 Qatar
-
 Reunion
-
 Romania
-
 Rwanda
-
 Saudi Arabia
-
 Serbia
-
 Singapore
-
 Slovakia
-
 Slovenia
-
 Somalia
-
 South Africa
-
 Spain
-
 Sri Lanka
-
 Sweden
-
 Switzerland
-
 Syria
-
 Taiwan
-
 Tajikistan
-
 Tanzania
-
 Thailand
-
 Trinidad and Tobago
-
 Tunisia
-
 Turkey
-
 UAE
-
 Uganda
-
 Ukraine
-
 United Kingdom
-
United States
-
 Uruguay
-
 Uzbekistan
-
 Venezuela
-
 Vietnam
-
 Yemen
-
 Zambia
-
 Zimbabwe
- Forex
- Crypto












