


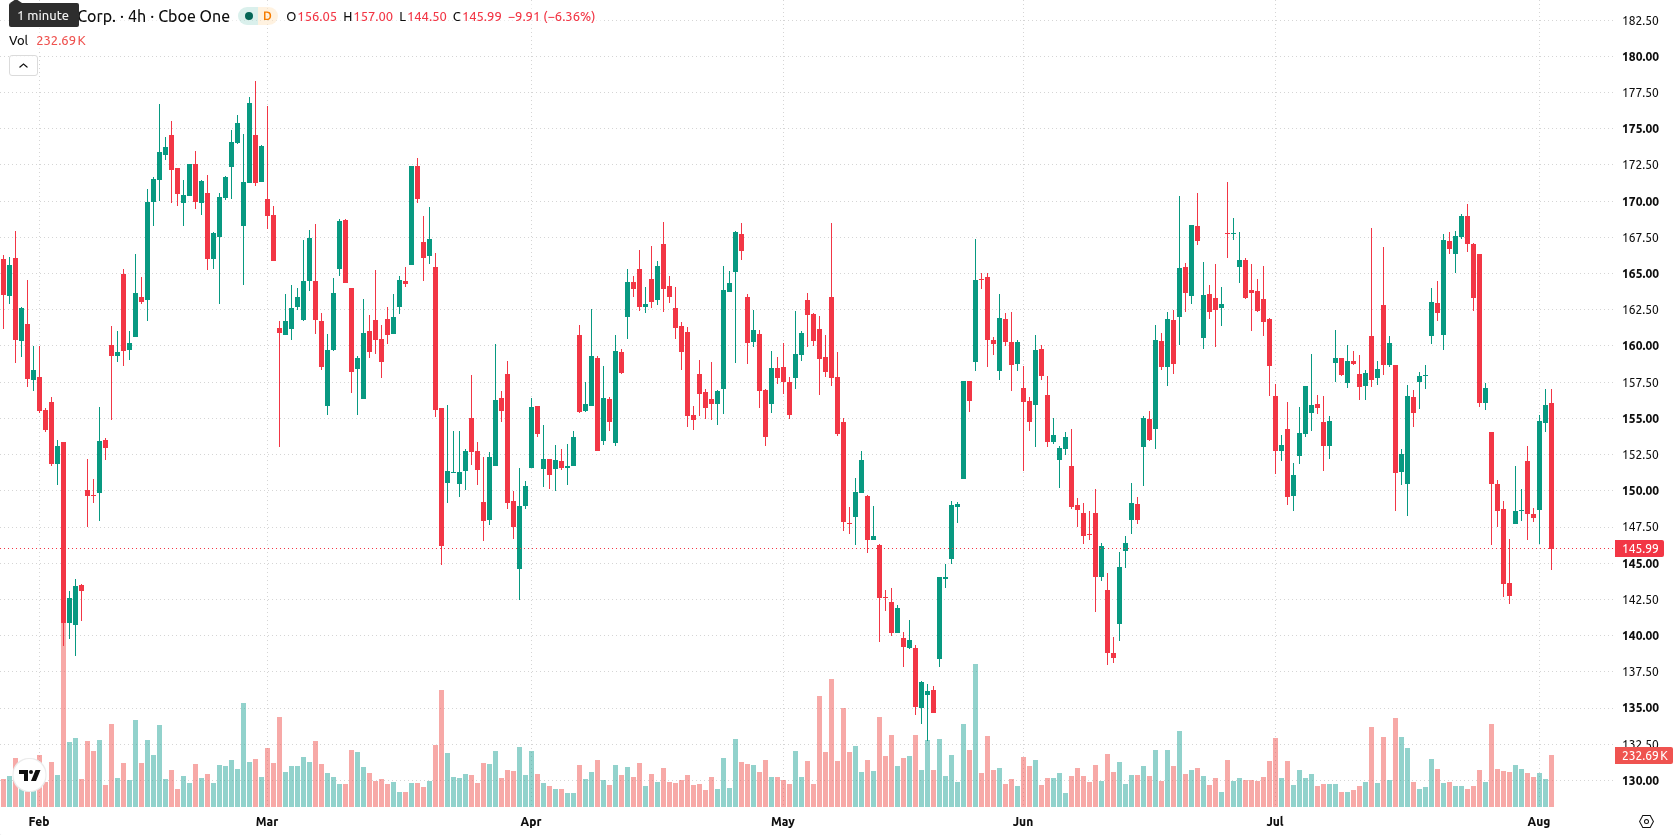
Vistra Corp. (VST) dropped 6.21% after an extended period of selling pressure, even as institutional investors reported notable increases in their holdings and the company maintained its regular dividend payout. The sharp decline is reinforced by the fact that the stock remains below all major moving averages, with technical signals pointing to continued weakness across both short- and long-term timeframes.
 134.70
Highlights
- Institutional investors added to Vistra positions in Q1 as the company expanded through its Cogentrix Energy acquisition.
- Vistra maintains a $0.23 quarterly dividend with a 0.6% yield but faces weather and regulatory risks as price action remains weak.
- Shares of Vistra trade below key moving averages under sustained selling pressure, with a projected five-day range of $136.2 to $153.57.
Investor accumulation rises amid operational growth and persistent risks
Several institutional investors increased their stakes in Vistra during the first quarter, including Wealth High Governance Capital Ltda, Segall Bryant & Hamill LLC, and Pine Valley Investments Ltd Liability Co. Vistra continues to pay a quarterly dividend of $0.23 per share, with an annualized yield of 0.6%. The company reported ongoing expansion through the acquisition of Cogentrix Energy and operates large-scale generation and retail businesses across 18 states, serving about 5 million customers. Vistra is exposed to operational risks from extreme weather events and regulatory changes, though price action has remained under broader selling pressure.
Technical boundaries widen as momentum signals show mixed bias
Vistra is trading below its 20-day, 50-day, and 200-day moving averages ($156.64, $156.39, and $163.55 respectively), highlighting sustained pressure from sellers in both the short and long term. The nearest technical resistance is at $153.57, and the closest support is the intraday low at $144.69. Momentum signals show conflicting indications, with the Moving Average Convergence Divergence (MACD) signaling a sell and the Average Directional Index (ADX) reading weak at 9.92, suggesting a lack of clear trend strength. The Relative Strength Index (RSI) sits near neutral at 50.09 with a buy forecast, while the Commodity Channel Index (CCI) and Awesome Oscillator (AO) indicate selling pressure. Stochastic RSI is neutral. Bull/Bear Power (BBP) is positive at 2.26, signaling buyers dominate intraday momentum, yet the overbought forecast suggests reversal risk. The stock opened nearly flat and is now down $9.69 or 6.21%, trading near today’s low. Intraday volatility stands at 7.81%. The tone is pressured and sellers remain in control after a weak open, reflecting the divergence among momentum indicators.
Earlier, analysts noted that Vistra remained under sustained selling pressure despite robust fundamentals, new business developments, and increasing institutional interest. The current analysis reinforces this narrative amid heightened volatility, with traders advised to watch for a potential range breakout between $144.69 support and $153.57 resistance in the near term.











-
 Afghanistan
-
 Albania
-
 Algeria
-
 Angola
-
 Argentina
-
 Armenia
-
 Australia
-
 Austria
-
 Azerbaijan
-
 Bahamas
-
 Bahrain
-
 Bangladesh
-
 Belarus
-
 Belgium
-
 Bolivia
-
 Botswana
-
 Brazil
-
 Brunei
-
 Bulgaria
-
 Cambodia
-
 Cameroon
-
 Canada
-
 Chile
-
 China
-
 Colombia
-
 Congo
-
 Costa Rica
-
 Cote d'Ivoire
-
 Croatia
-
 Cuba
-
 Cyprus
-
 Czechia
-
 DR Congo
-
 Denmark
-
 Dominican Republic
-
 Ecuador
-
 Egypt
-
 El Salvador
-
 Estonia
-
 Eswatini
-
 Ethiopia
-
 Finland
-
 France
-
 Georgia
-
 Germany
-
 Ghana
-
 Greece
-
 Haiti
-
 Hong Kong
-
 Hungary
-
 India
-
 Indonesia
-
 Iran, Islamic republic
-
 Iraq
-
 Ireland
-
 Israel
-
 Italy
-
 Jamaica
-
 Japan
-
 Jordan
-
 Kazakhstan
-
 Kenya
-
 Korea
-
 Kuwait
-
 Kyrgyzstan
-
 Laos
-
 Latvia
-
 Lebanon
-
 Lesotho
-
 Libya
-
 Lithuania
-
 Luxembourg
-
 Madagascar
-
 Malaysia
-
 Malta
-
 Mauritius
-
 Mexico
-
 Moldova
-
 Mongolia
-
 Montenegro
-
 Morocco
-
 Mozambique
-
 Myanmar
-
 Namibia
-
 Nepal
-
 Netherlands
-
 New Zealand
-
 Nigeria
-
 North Macedonia
-
 Norway
-
 Oman
-
 Pakistan
-
 Palestine
-
 Panama
-
 Papua New Guinea
-
 Paraguay
-
 Peru
-
 Philippines
-
 Poland
-
 Portugal
-
 Puerto Rico
-
 Qatar
-
 Reunion
-
 Romania
-
 Rwanda
-
 Saudi Arabia
-
 Serbia
-
 Singapore
-
 Slovakia
-
 Slovenia
-
 Somalia
-
 South Africa
-
 Spain
-
 Sri Lanka
-
 Sweden
-
 Switzerland
-
 Syria
-
 Taiwan
-
 Tajikistan
-
 Tanzania
-
 Thailand
-
 Trinidad and Tobago
-
 Tunisia
-
 Turkey
-
 UAE
-
 Uganda
-
 Ukraine
-
 United Kingdom
-
United States
-
 Uruguay
-
 Uzbekistan
-
 Venezuela
-
 Vietnam
-
 Yemen
-
 Zambia
-
 Zimbabwe
- Forex
- Crypto












