

Vistra shares gain almost 10% after raising full-year guidance and completing Cogentrix acquisition

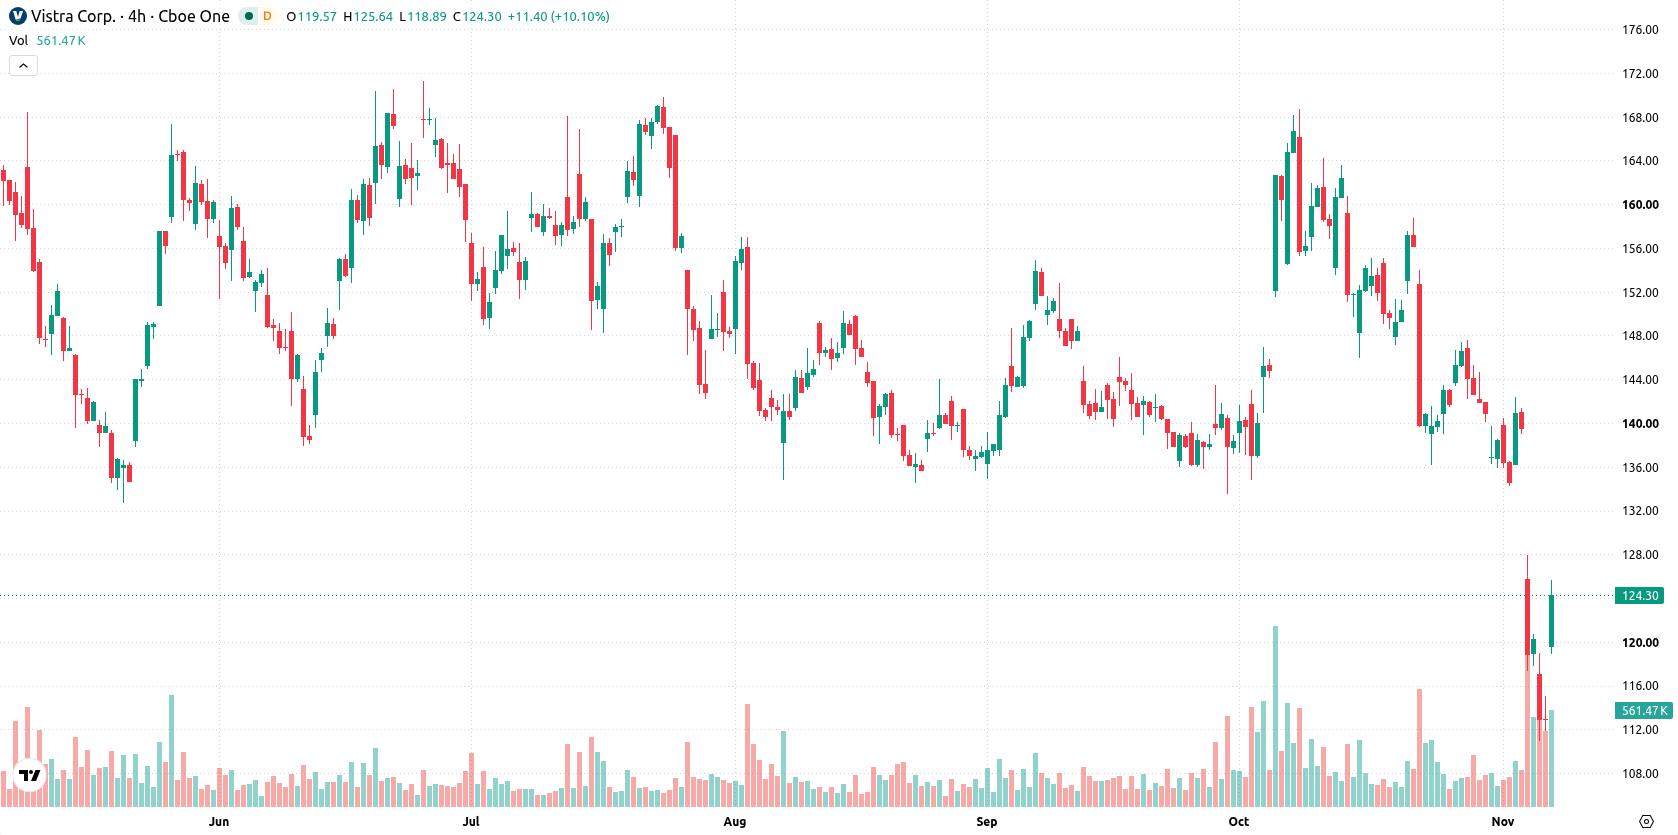
Vistra Corp. (VST) surged 9.88% after strong third-quarter financial results and an upbeat full-year EBITDA outlook energized buying appetite. The advance looks limited, with the stock still trading below its 20-day, 50-day, and 200-day moving averages, confirming sellers retain technical control across all timeframes.
 131.16
136.67
Highlights
- Vistra reported third-quarter GAAP net income of $1.14 billion and raised 2026 Adjusted EBITDA guidance to $7.1 billion to $7.5 billion.
- The company completed its acquisition of Cogentrix Energy, adding ten natural gas plants, and expanded its buyback authorization.
- Shares of Vistra trade below key moving averages with indicators in oversold zones, showing seller dominance but potential for a rebound within a $108.43 to $139.69 range over the next five days.
Upgraded EBITDA outlook and buyback expansion drive sentiment shift
Vistra reported third-quarter GAAP net income of $1.14 billion, aided partially by unrealized gains from hedging activities. The company raised and narrowed its full-year 2026 Adjusted EBITDA guidance to $7.1-7.5 billion, and offered a 2027 outlook with EBITDA expected between $7.7 billion and $8.5 billion. It also completed the Cogentrix Energy acquisition, adding ten modern natural gas plants, while declaring a quarterly dividend of $0.231 per share and expanding its buyback authorization.
Bearish setup persists amid oversold signals and failed reversal
Vistra remains under sustained selling pressure, trading below its 20-day, 50-day, and 200-day moving averages at $144.75, $144.21, and $152.82, respectively. The immediate resistance is at $139.69, with the latest intraday high at $118.84 marking the near-term floor. The technical outlook is bearish, as highlighted by the 50-day average staying below the 200-day. Momentum indicators confirm a negative setup: the MACD signals selling, the ADX trend is soft, and the RSI, Stochastic RSI, and CCI are all situated in oversold zones. This reflects exhaustion of recent downside pressure but not a confirmed reversal. Bull/Bear Power is negative and the Awesome Oscillator shows further selling, even as price strength toward session highs and intraday volatility of 7.04% reveal a divergence between weak momentum and price action.
Earlier, analysts noted that Vistra remained in a bearish technical setup despite portfolio expansion and continued to face persistent selling pressure. The latest rally has yet to alter the underlying technical weakness, and traders should monitor the $139.69 resistance level for any potential signal of a sustained trend shift.











-
 Afghanistan
-
 Albania
-
 Algeria
-
 Angola
-
 Argentina
-
 Armenia
-
 Australia
-
 Austria
-
 Azerbaijan
-
 Bahamas
-
 Bahrain
-
 Bangladesh
-
 Belarus
-
 Belgium
-
 Bolivia
-
 Botswana
-
 Brazil
-
 Brunei
-
 Bulgaria
-
 Cambodia
-
 Cameroon
-
 Canada
-
 Chile
-
 China
-
 Colombia
-
 Congo
-
 Costa Rica
-
 Cote d'Ivoire
-
 Croatia
-
 Cuba
-
 Cyprus
-
 Czechia
-
 DR Congo
-
 Denmark
-
 Dominican Republic
-
 Ecuador
-
 Egypt
-
 El Salvador
-
 Estonia
-
 Eswatini
-
 Ethiopia
-
 Finland
-
 France
-
 Georgia
-
 Germany
-
 Ghana
-
 Greece
-
 Haiti
-
 Hong Kong
-
 Hungary
-
 India
-
 Indonesia
-
 Iran, Islamic republic
-
 Iraq
-
 Ireland
-
 Israel
-
 Italy
-
 Jamaica
-
 Japan
-
 Jordan
-
 Kazakhstan
-
 Kenya
-
 Korea
-
 Kuwait
-
 Kyrgyzstan
-
 Laos
-
 Latvia
-
 Lebanon
-
 Lesotho
-
 Libya
-
 Lithuania
-
 Luxembourg
-
 Madagascar
-
 Malaysia
-
 Malta
-
 Mauritius
-
 Mexico
-
 Moldova
-
 Mongolia
-
 Montenegro
-
 Morocco
-
 Mozambique
-
 Myanmar
-
 Namibia
-
 Nepal
-
 Netherlands
-
 New Zealand
-
 Nigeria
-
 North Macedonia
-
 Norway
-
 Oman
-
 Pakistan
-
 Palestine
-
 Panama
-
 Papua New Guinea
-
 Paraguay
-
 Peru
-
 Philippines
-
 Poland
-
 Portugal
-
 Puerto Rico
-
 Qatar
-
 Reunion
-
 Romania
-
 Rwanda
-
 Saudi Arabia
-
 Serbia
-
 Singapore
-
 Slovakia
-
 Slovenia
-
 Somalia
-
 South Africa
-
 Spain
-
 Sri Lanka
-
 Sweden
-
 Switzerland
-
 Syria
-
 Taiwan
-
 Tajikistan
-
 Tanzania
-
 Thailand
-
 Trinidad and Tobago
-
 Tunisia
-
 Turkey
-
 UAE
-
 Uganda
-
 Ukraine
-
 United Kingdom
-
United States
-
 Uruguay
-
 Uzbekistan
-
 Venezuela
-
 Vietnam
-
 Yemen
-
 Zambia
-
 Zimbabwe
- Forex
- Crypto












