


Vistra Corp. (VST) slid 7.28% after a sharp downward open, even as the company posted solid second-quarter 2026 earnings and advanced with major nuclear investments and long-term power contracts. The drop contrasts with underlying bullish momentum as the stock trades above its 20-day and 50-day moving averages, though longer-term resistance remains a limiting factor.
 155.16
164.19
155.16
164.19
Highlights
- Vistra reported second-quarter 2026 revenue of $4.02 billion with a net profit of $305 million and maintained 2026 adjusted EBITDA guidance.
- The company continues its $1.2 billion share buyback authorization and has retired roughly 30% of outstanding shares since November 2021.
- Shares of Vistra declined 7.28% with volatile trading, but technical signals indicate underlying bullish momentum and an expected 5-day range of $143.73 to $157.35.
Share buybacks and long-term deals fail to counter persistent selling
Vistra Corp. reported second-quarter 2026 financial results with $4.02 billion in revenue and a net profit of $305 million. The company reaffirmed its 2026 adjusted EBITDA guidance, maintained its share buyback program with $1.2 billion in authorization remaining, and has reduced outstanding shares by about 30% since November 2021. The U.S. Department of Energy committed up to $4.2 billion in conditional loan support for nuclear modernization and capacity expansion, and Vistra secured 20-year power agreements with Amazon and Meta, alongside new partnerships for its Helix Digital Infrastructure venture, though price action has remained under broader selling pressure.
Bullish momentum meets overbought signals as volatility spikes
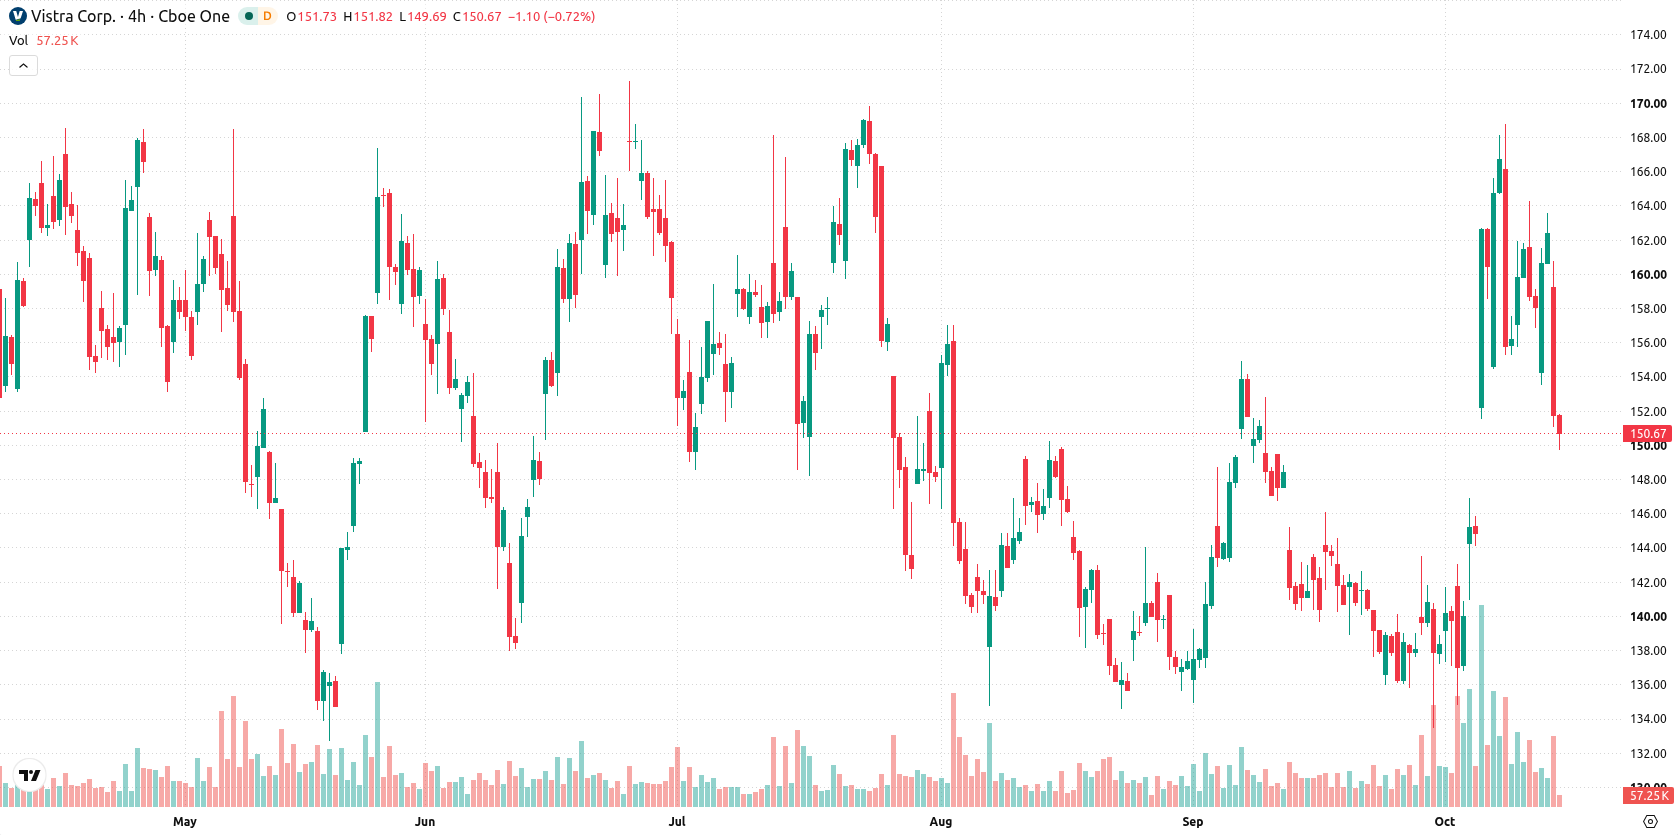
VST trades above its 20-day and 50-day moving averages ($146.42 and $144.24), signaling bullish momentum over the short and medium term. However, it remains below the 200-day moving average ($154.73), with $151.18 as immediate resistance (Ichimoku Kijun) and $149.66 as the near-term support. Momentum indicators are mixed: both MACD and RSI reflect buying interest, while the ADX stays neutral. The Stochastic RSI supports ongoing bullish momentum, but the CCI and BBP indicate overbought conditions, with BBP highlighting buyer dominance and emerging signs of short-term exhaustion. The stock is experiencing high volatility after a downside gap and rapid correction.
Earlier, analysts noted that Vistra was experiencing persistent selling pressure despite robust corporate initiatives and technical strength. The latest results and major contract wins add a new dimension, making $151.18 a key level to watch for signs of a sustained breakout or renewed downward momentum.









-
 Afghanistan
-
 Albania
-
 Algeria
-
 Angola
-
 Argentina
-
 Armenia
-
 Australia
-
 Austria
-
 Azerbaijan
-
 Bahamas
-
 Bahrain
-
 Bangladesh
-
 Belarus
-
 Belgium
-
 Bolivia
-
 Botswana
-
 Brazil
-
 Brunei
-
 Bulgaria
-
 Cambodia
-
 Cameroon
-
 Canada
-
 Chile
Chile
-
 China
China
-
 Colombia
-
 Congo
Congo
-
 Costa Rica
-
 Cote d'Ivoire
-
 Croatia
-
 Cuba
Cuba
-
 Cyprus
-
 Czechia
-
 DR Congo
-
 Denmark
-
 Dominican Republic
-
 Ecuador
-
 Egypt
Egypt
-
 El Salvador
-
 Estonia
-
 Eswatini
-
 Ethiopia
-
 Finland
-
 France
-
 Georgia
-
 Germany
-
 Ghana
Ghana
-
 Greece
-
 Haiti
Haiti
-
 Hong Kong
-
 Hungary
-
 India
India
-
 Indonesia
-
 Iran, Islamic republic
-
 Iraq
Iraq
-
 Ireland
-
 Israel
-
 Italy
Italy
-
 Jamaica
-
 Japan
Japan
-
 Jordan
-
 Kazakhstan
-
 Kenya
Kenya
-
 Korea
Korea
-
 Kuwait
-
 Kyrgyzstan
-
 Laos
Laos
-
 Latvia
-
 Lebanon
-
 Lesotho
-
 Libya
Libya
-
 Lithuania
-
 Luxembourg
-
 Madagascar
-
 Malaysia
-
 Malta
Malta
-
 Mauritius
-
 Mexico
-
 Moldova
-
 Mongolia
-
 Montenegro
-
 Morocco
-
 Mozambique
-
 Myanmar
-
 Namibia
-
 Nepal
Nepal
-
 Netherlands
-
 New Zealand
-
 Nigeria
-
 North Macedonia
-
 Norway
-
 Oman
Oman
-
 Pakistan
-
 Palestine
-
 Panama
-
 Papua New Guinea
-
 Paraguay
-
 Peru
Peru
-
 Philippines
-
 Poland
-
 Portugal
-
 Puerto Rico
-
 Qatar
Qatar
-
 Reunion
-
 Romania
-
 Rwanda
-
 Saudi Arabia
-
 Serbia
-
 Singapore
-
 Slovakia
-
 Slovenia
-
 Somalia
-
 South Africa
-
 Spain
Spain
-
 Sri Lanka
-
 Sweden
-
 Switzerland
-
 Syria
Syria
-
 Taiwan
-
 Tajikistan
-
 Tanzania
-
 Thailand
-
 Trinidad and Tobago
-
 Tunisia
-
 Turkey
-
 UAE
UAE
-
 Uganda
-
 Ukraine
-
 United Kingdom
-
United States
-
 Uruguay
-
 Uzbekistan
-
 Venezuela
-
 Vietnam
-
 Yemen
Yemen
-
 Zambia
-
 Zimbabwe
- Forex
- Crypto












