

VST slides over 5% as technical signals confirm seller dominance despite improved guidance

Vistra Corp. (VST) slumped 5.35% after sector-wide selling pressure hit utilities tied to artificial intelligence and data center power demand, even as the company reported record earnings and reaffirmed its guidance. The downswing is reinforced by the stock trading below its 20-day, 50-day, and 200-day moving averages, underscoring continued dominance by sellers across all timeframes.
 133.49
136.67
Highlights
- Vistra delivered record first quarter earnings for 2026 and maintained its robust full-year guidance, citing surging data center and hyperscale demand.
- The company advanced a $3 billion share repurchase and dividend initiative, while also securing a 20-year nuclear supply contract with Meta and attracting major institutional investors.
- Despite strong fundamentals, Vistra's shares trade below key technical averages under sustained selling pressure, with a projected near-term range of $141.60–$155.76 and a 70% probability of further decline.
Institutional accumulation persists as broader selling pressure tests sentiment
Vistra Corp. reported record first quarter earnings in 2026 and reaffirmed its full-year outlook, citing strong demand from data centers and hyperscale clients. The company has also moved forward with a $3 billion buyback and dividend plan, including recent increases to its quarterly dividend and the use of a 10b5-1 repurchase program. Vistra signed 20-year nuclear power supply agreements with Meta, and institutional investors such as Advent International and Empowered Funds have taken significant positions, though price action has remained under broader selling pressure.
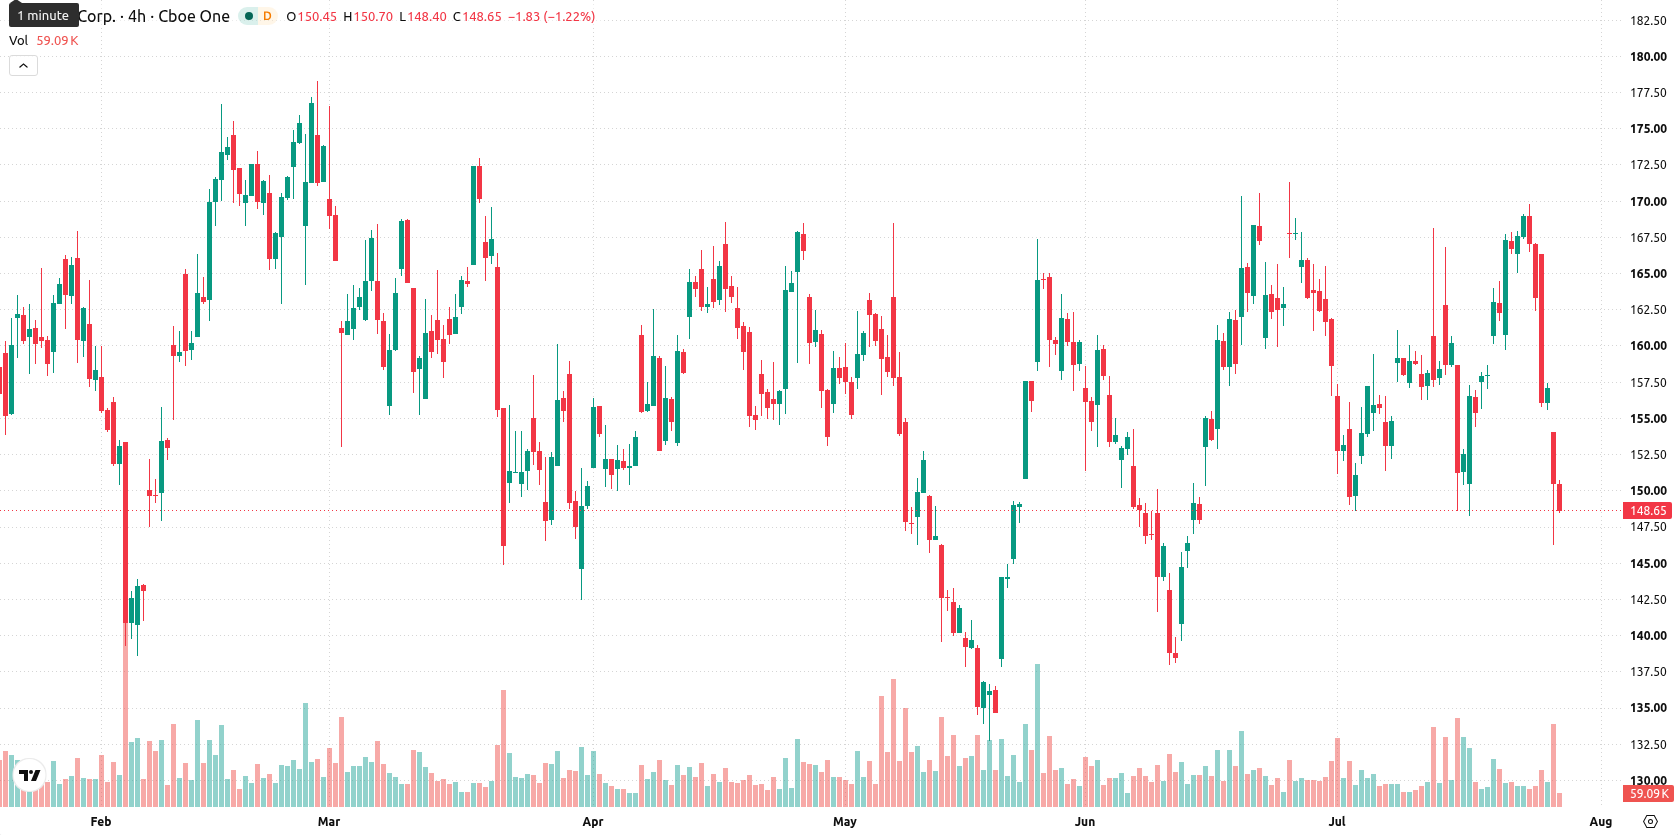
Technical breakdown highlighted by mixed momentum and volatility spike
Vistra is trading below its 20-day, 50-day, and 200-day moving averages at $158.56, $155.44, and $164.97 respectively, signaling sellers are in control across short-, medium-, and long-term trends. The near-term ceiling is $153.59 and the nearest support is the session low at $146.52, with additional confirmation of bearish pressure from the Ichimoku Kijun at $159.79 and a bearish longer-term alignment of the 50-day and 200-day averages. Momentum indicators are mixed. The Moving Average Convergence Divergence (MACD) points to continued buying interest, while the Average Directional Index (ADX) remains weak at 9.4, indicating a lack of trend strength. The Relative Strength Index (RSI) at 48.09 leans toward the sell side, and Stochastic RSI is deeply oversold at 18.47 signaling short-term exhaustion among sellers. Bull/Bear Power (BBP) at 5.11 shows buyers dominating intraday action, but is labeled overbought, suggesting risk of a near-term reversal. The Awesome Oscillator signals buy momentum, supporting the medium-term trend. The stock is down $8.4 or 5.35% so far today, having opened with a downside gap of around $3.49 or 2.22%, and sits near the session low. Intraday volatility stands at 4.83%, indicating brisk selling pressure after the open. Overall, momentum indicators diverge, with buyers dominating the tape but most signals leaning to the downside.
Earlier, analysts noted that Vistra continued to face significant selling pressure despite strong fundamentals, new business catalysts, and institutional accumulation. The latest selloff—alongside persistent bearish momentum across multiple timeframes—reinforces the importance of monitoring whether the stock can stabilize within the projected trading range or if a breakdown below $146.52 triggers further downside risk.











-
 Afghanistan
-
 Albania
-
 Algeria
-
 Angola
-
 Argentina
-
 Armenia
-
 Australia
-
 Austria
-
 Azerbaijan
-
 Bahamas
-
 Bahrain
-
 Bangladesh
-
 Belarus
-
 Belgium
-
 Bolivia
-
 Botswana
-
 Brazil
-
 Brunei
-
 Bulgaria
-
 Cambodia
-
 Cameroon
-
 Canada
-
 Chile
-
 China
-
 Colombia
-
 Congo
-
 Costa Rica
-
 Cote d'Ivoire
-
 Croatia
-
 Cuba
-
 Cyprus
-
 Czechia
-
 DR Congo
-
 Denmark
-
 Dominican Republic
-
 Ecuador
-
 Egypt
-
 El Salvador
-
 Estonia
-
 Eswatini
-
 Ethiopia
-
 Finland
-
 France
-
 Georgia
-
 Germany
-
 Ghana
-
 Greece
-
 Haiti
-
 Hong Kong
-
 Hungary
-
 India
-
 Indonesia
-
 Iran, Islamic republic
-
 Iraq
-
 Ireland
-
 Israel
-
 Italy
-
 Jamaica
-
 Japan
-
 Jordan
-
 Kazakhstan
-
 Kenya
-
 Korea
-
 Kuwait
-
 Kyrgyzstan
-
 Laos
-
 Latvia
-
 Lebanon
-
 Lesotho
-
 Libya
-
 Lithuania
-
 Luxembourg
-
 Madagascar
-
 Malaysia
-
 Malta
-
 Mauritius
-
 Mexico
-
 Moldova
-
 Mongolia
-
 Montenegro
-
 Morocco
-
 Mozambique
-
 Myanmar
-
 Namibia
-
 Nepal
-
 Netherlands
-
 New Zealand
-
 Nigeria
-
 North Macedonia
-
 Norway
-
 Oman
-
 Pakistan
-
 Palestine
-
 Panama
-
 Papua New Guinea
-
 Paraguay
-
 Peru
-
 Philippines
-
 Poland
-
 Portugal
-
 Puerto Rico
-
 Qatar
-
 Reunion
-
 Romania
-
 Rwanda
-
 Saudi Arabia
-
 Serbia
-
 Singapore
-
 Slovakia
-
 Slovenia
-
 Somalia
-
 South Africa
-
 Spain
-
 Sri Lanka
-
 Sweden
-
 Switzerland
-
 Syria
-
 Taiwan
-
 Tajikistan
-
 Tanzania
-
 Thailand
-
 Trinidad and Tobago
-
 Tunisia
-
 Turkey
-
 UAE
-
 Uganda
-
 Ukraine
-
 United Kingdom
-
United States
-
 Uruguay
-
 Uzbekistan
-
 Venezuela
-
 Vietnam
-
 Yemen
-
 Zambia
-
 Zimbabwe
- Forex
- Crypto












