

Home Depot shares weekly forecast: Facing resistance near $352 as momentum signals turn mixed

Shares of The Home Depot, Inc. (HD) are trading near $352 after rallying nearly 6% this week, with the stock now brushing up against overbought conditions. The move reflects renewed optimism after recent corporate actions, though stretched momentum signals a pause may be ahead. Traders are watching to see if support holds as the market digests this strong run.
 341.54
Highlights
- Shares of Home Depot rose 6.02% over the past week, pushing prices near the top of the current range.
- Momentum signals are mixed, with some indicators showing overbought conditions and trend strength remaining flat.
- Home Depot stock is expected to consolidate between $333.65 and $361.51, with $350.8 as key support and $361.51 as resistance.
Organizational shake-up and mixed fund flows drive sentiment this week
Home Depot announced organizational restructuring on July 30, 2026 to accelerate innovation and boost market share, according to a PR Newswire release reported by TradingView. The week also brought corporate activity as Sapient Capital LLC trimmed its stake in HD while WNY Asset Management LLC initiated a new position, as reported by Markets Daily and Ticker Report. The company maintained its fiscal 2026 earnings guidance at $14.69–$15.28 per share and distributed a $2.33 quarterly dividend on June 18, 2026, translating to a 2.8% annualized yield.
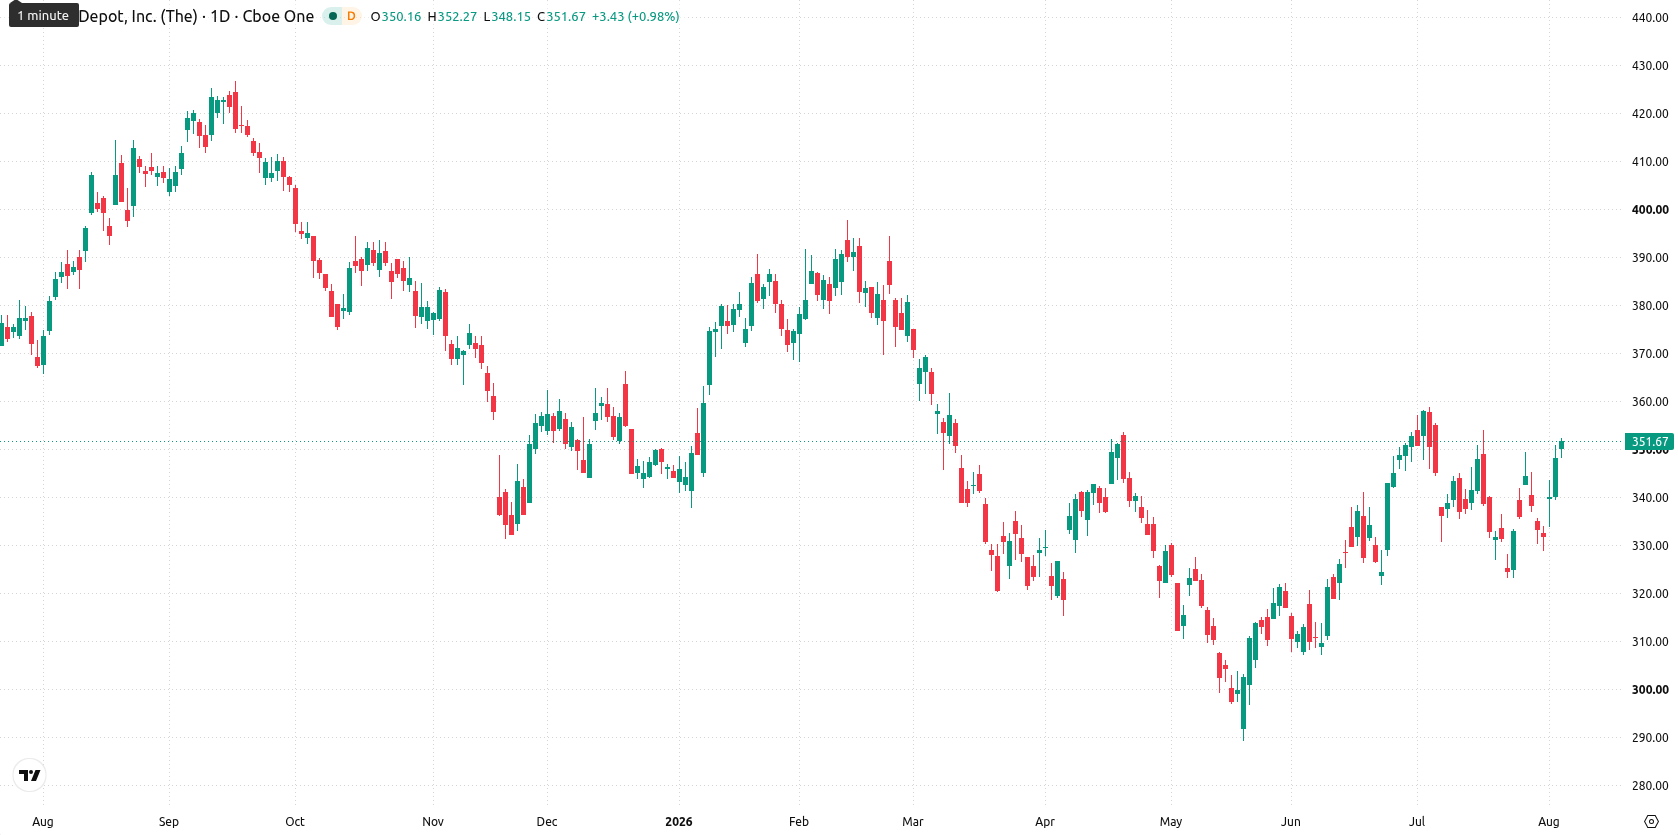
Overbought oscillators and flat trend as weekly resistance holds
On the daily chart, the move has pushed the price to the very top of its weekly range near resistance, with volatility over the past week at 6.64%. Momentum signals are mixed: the RSI stands in the neutral zone at 58.24, while both CCI and Stochastic RSI are overbought, indicating temporary upside exhaustion. The nearest support sits at $350.8—right below the current price and marked by last week’s high—while Ichimoku Kijun at $340.95 adds a second layer of support. This setup suggests a contained move within a narrow range, with momentum appearing stretched but trend strength staying flat.
Upside bias but range-bound as breakout risks shape next week
For the next five trading days, Home Depot is expected to trade between $333.65 and $361.51. The probability of an increase sits at 71%, versus 29% for a decline. The base case is a continued consolidation between $350.8 support and the upper part of the range. A break above $361.51 could trigger further gains, while a definitive move below $350.8 would expose the stock to downside toward the $340.95 area.
Earlier, analysts noted that Home Depot shares were displaying strong short-term momentum while consolidating near key technical boundaries as the company set fresh financial guidance. The current setup signals price compression near resistance, highlighting the importance of monitoring $350.8 as a pivotal support for any shift in near-term trend.









-
 Afghanistan
-
 Albania
-
 Algeria
-
 Angola
-
 Argentina
-
 Armenia
-
 Australia
-
 Austria
-
 Azerbaijan
-
 Bahamas
-
 Bahrain
-
 Bangladesh
-
 Belarus
-
 Belgium
-
 Bolivia
-
 Botswana
-
 Brazil
-
 Brunei
-
 Bulgaria
-
 Cambodia
-
 Cameroon
-
 Canada
-
 Chile
-
 China
-
 Colombia
-
 Congo
-
 Costa Rica
-
 Cote d'Ivoire
-
 Croatia
-
 Cuba
-
 Cyprus
-
 Czechia
-
 DR Congo
-
 Denmark
-
 Dominican Republic
-
 Ecuador
-
 Egypt
-
 El Salvador
-
 Estonia
-
 Eswatini
-
 Ethiopia
-
 Finland
-
 France
-
 Georgia
-
 Germany
-
 Ghana
-
 Greece
-
 Haiti
-
 Hong Kong
-
 Hungary
-
 India
-
 Indonesia
-
 Iran, Islamic republic
-
 Iraq
-
 Ireland
-
 Israel
-
 Italy
-
 Jamaica
-
 Japan
-
 Jordan
-
 Kazakhstan
-
 Kenya
-
 Korea
-
 Kuwait
-
 Kyrgyzstan
-
 Laos
-
 Latvia
-
 Lebanon
-
 Lesotho
-
 Libya
-
 Lithuania
-
 Luxembourg
-
 Madagascar
-
 Malaysia
-
 Malta
-
 Mauritius
-
 Mexico
-
 Moldova
-
 Mongolia
-
 Montenegro
-
 Morocco
-
 Mozambique
-
 Myanmar
-
 Namibia
-
 Nepal
-
 Netherlands
-
 New Zealand
-
 Nigeria
-
 North Macedonia
-
 Norway
-
 Oman
-
 Pakistan
-
 Palestine
-
 Panama
-
 Papua New Guinea
-
 Paraguay
-
 Peru
-
 Philippines
-
 Poland
-
 Portugal
-
 Puerto Rico
-
 Qatar
-
 Reunion
-
 Romania
-
 Rwanda
-
 Saudi Arabia
-
 Serbia
-
 Singapore
-
 Slovakia
-
 Slovenia
-
 Somalia
-
 South Africa
-
 Spain
-
 Sri Lanka
-
 Sweden
-
 Switzerland
-
 Syria
-
 Taiwan
-
 Tajikistan
-
 Tanzania
-
 Thailand
-
 Trinidad and Tobago
-
 Tunisia
-
 Turkey
-
 UAE
-
 Uganda
-
 Ukraine
-
 United Kingdom
-
United States
-
 Uruguay
-
 Uzbekistan
-
 Venezuela
-
 Vietnam
-
 Yemen
-
 Zambia
-
 Zimbabwe
- Forex
- Crypto












