

Can full-year 2026 earnings guidance raise fuel Dupont stock?

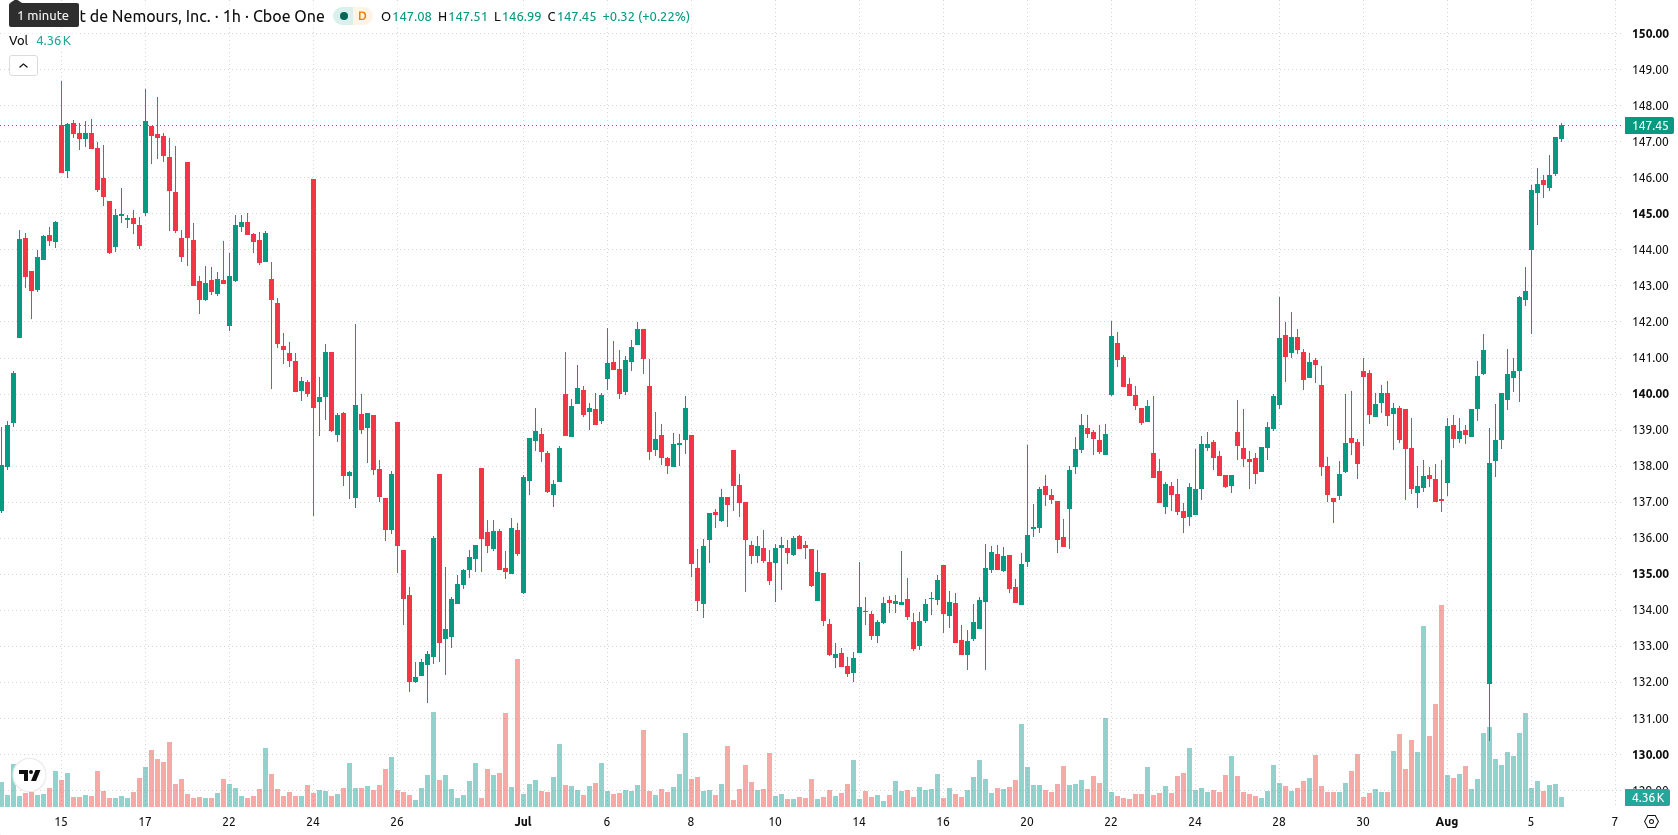
Dupont (DD) stock is trading at $147.29 after rising 3.05% on the day. The price remains solidly above its key moving averages, reflecting positive short-term momentum.
 153.09
155.90
Highlights
- Dupont posted Q2 adjusted earnings of $1.88 per diluted share and $1.82 billion in revenue, both beating expectations.
- The company increased full-year guidance, announced a $250 million share repurchase, and flagged over $1 billion reserved for acquisitions.
- Dupont stock trades in a bullish technical structure with intense buying pressure, forecast to range between $141.32 and $153.26 in coming sessions.
Profit beat and guidance raise fuel investor demand amid new buyback
Dupont's second-quarter 2026 results showed adjusted earnings rising to $1.88 per diluted share from $1.27 a year earlier and revenue reaching $1.82 billion, both exceeding expectations, according to Marketscreener. This earnings beat points to an improvement in the company’s underlying profitability, directly supporting demand for shares. Management reinforced confidence by raising full-year guidance and unveiling a $250 million share repurchase plan to be launched in the third quarter, steps likely to appeal to investors seeking both growth and capital returns. Secondary developments, such as reserving over $1 billion for potential acquisitions and a narrowed sales outlook due to Middle East demand and currency risks, round out the news backdrop for DD.
Overbought signals diverge from bullish trend as technicals firm
On the technical front, DD trades above the MA-20 ($141.36) and MA-50 ($140.01) on the 1-hour chart, with substantial separation from the long-term MA-200 at $58.64. The Ichimoku Kijun sits at $138.47, acting as near-term support for the current trend. MACD currently flashes a buy, while ADX is neutral, indicating indecisive trend strength. RSI, Stoch RSI, CCI, and Bull/Bear Power are positioned firmly in overbought or buyer-dominant territory, joined by a bullish Awesome Oscillator reading. However, the prevalence of overbought oscillators signals potential for exhaustion or pullback, introducing divergence with the positive momentum indicators.
Bullish bias persists as price nears key resistance in volatile range
In the short term, DD is likely to trade within the $141.32 to $153.26 band, reflecting typical volatility levels relative to recent moves. With a 74% probability favoring further gains, a bullish scenario would see DD break through the upper resistance of this corridor. If momentum fades or profit-taking sets in, a dip below the $141.32 support could shift the price into a consolidation or mild correction.
Earlier, analysts noted that Dupont shares faced pressure despite beating previous earnings expectations, with concerns centered on outlook softness and headwinds in its water business. The latest quarterly results and updated guidance suggest improved operational momentum, but with technical overbought signals now flashing, traders should monitor for a potential shift to consolidation if the price fails to maintain its current breakout.






Latest Dupont De Nemours Inc News





-
 Afghanistan
-
 Albania
-
 Algeria
-
 Angola
-
 Argentina
-
 Armenia
-
 Australia
-
 Austria
-
 Azerbaijan
-
 Bahamas
-
 Bahrain
-
 Bangladesh
-
 Belarus
-
 Belgium
-
 Bolivia
-
 Botswana
-
 Brazil
-
 Brunei
-
 Bulgaria
-
 Cambodia
-
 Cameroon
-
 Canada
-
 Chile
-
 China
-
 Colombia
-
 Congo
-
 Costa Rica
-
 Cote d'Ivoire
-
 Croatia
-
 Cuba
-
 Cyprus
-
 Czechia
-
 DR Congo
-
 Denmark
-
 Dominican Republic
-
 Ecuador
-
 Egypt
-
 El Salvador
-
 Estonia
-
 Eswatini
-
 Ethiopia
-
 Finland
-
 France
-
 Georgia
-
 Germany
-
 Ghana
-
 Greece
-
 Haiti
-
 Hong Kong
-
 Hungary
-
 India
-
 Indonesia
-
 Iran, Islamic republic
-
 Iraq
-
 Ireland
-
 Israel
-
 Italy
-
 Jamaica
-
 Japan
-
 Jordan
-
 Kazakhstan
-
 Kenya
-
 Korea
-
 Kuwait
-
 Kyrgyzstan
-
 Laos
-
 Latvia
-
 Lebanon
-
 Lesotho
-
 Libya
-
 Lithuania
-
 Luxembourg
-
 Madagascar
-
 Malaysia
-
 Malta
-
 Mauritius
-
 Mexico
-
 Moldova
-
 Mongolia
-
 Montenegro
-
 Morocco
-
 Mozambique
-
 Myanmar
-
 Namibia
-
 Nepal
-
 Netherlands
-
 New Zealand
-
 Nigeria
-
 North Macedonia
-
 Norway
-
 Oman
-
 Pakistan
-
 Palestine
-
 Panama
-
 Papua New Guinea
-
 Paraguay
-
 Peru
-
 Philippines
-
 Poland
-
 Portugal
-
 Puerto Rico
-
 Qatar
-
 Reunion
-
 Romania
-
 Rwanda
-
 Saudi Arabia
-
 Serbia
-
 Singapore
-
 Slovakia
-
 Slovenia
-
 Somalia
-
 South Africa
-
 Spain
-
 Sri Lanka
-
 Sweden
-
 Switzerland
-
 Syria
-
 Taiwan
-
 Tajikistan
-
 Tanzania
-
 Thailand
-
 Trinidad and Tobago
-
 Tunisia
-
 Turkey
-
 UAE
-
 Uganda
-
 Ukraine
-
 United Kingdom
-
United States
-
 Uruguay
-
 Uzbekistan
-
 Venezuela
-
 Vietnam
-
 Yemen
-
 Zambia
-
 Zimbabwe
- Forex
- Crypto












