

Will Agnico Eagle Mines stock break C$249.61 resistance after upbeat Q2 earnings?

Agnico Eagle Mines (AEM) stock is trading at C$235.41, gaining 1.36% for the day. The price currently sits above its key short- and medium-term moving averages but remains below long-term trend levels.
 254.88
278.24
Highlights
- Agnico Eagle Mines reported Q2 2026 adjusted EPS of $3.05, beating estimates for the fourth straight quarter and signaling operational momentum.
- The company raised its full-year 2026 production guidance and reiterated intentions for at least a stable dividend, improving forward revenue and cash yield visibility.
- Agnico Eagle Mines stock trades with strong short-term bullish momentum, projected to range between C$221.21 and C$249.61 with a 75% probability of further upside.
Sustained earnings beats and guidance boost as investors anticipate higher profits
Agnico Eagle Mines Limited posted a Q2 2026 adjusted EPS of $3.05, surpassing consensus estimates for the fourth consecutive quarter, according to Wealthawesome. This string of earnings beats highlights the company’s ongoing operational strength, fueling demand from investors anticipating sustained profitability. Adding to this momentum, Agnico Eagle Mines has increased its full-year 2026 production targets, improving forward revenue visibility, while reaffirming its commitment to a stable or rising dividend policy, as reported by Tradingkey. Together, these developments provide a solid foundation for today’s buying interest.
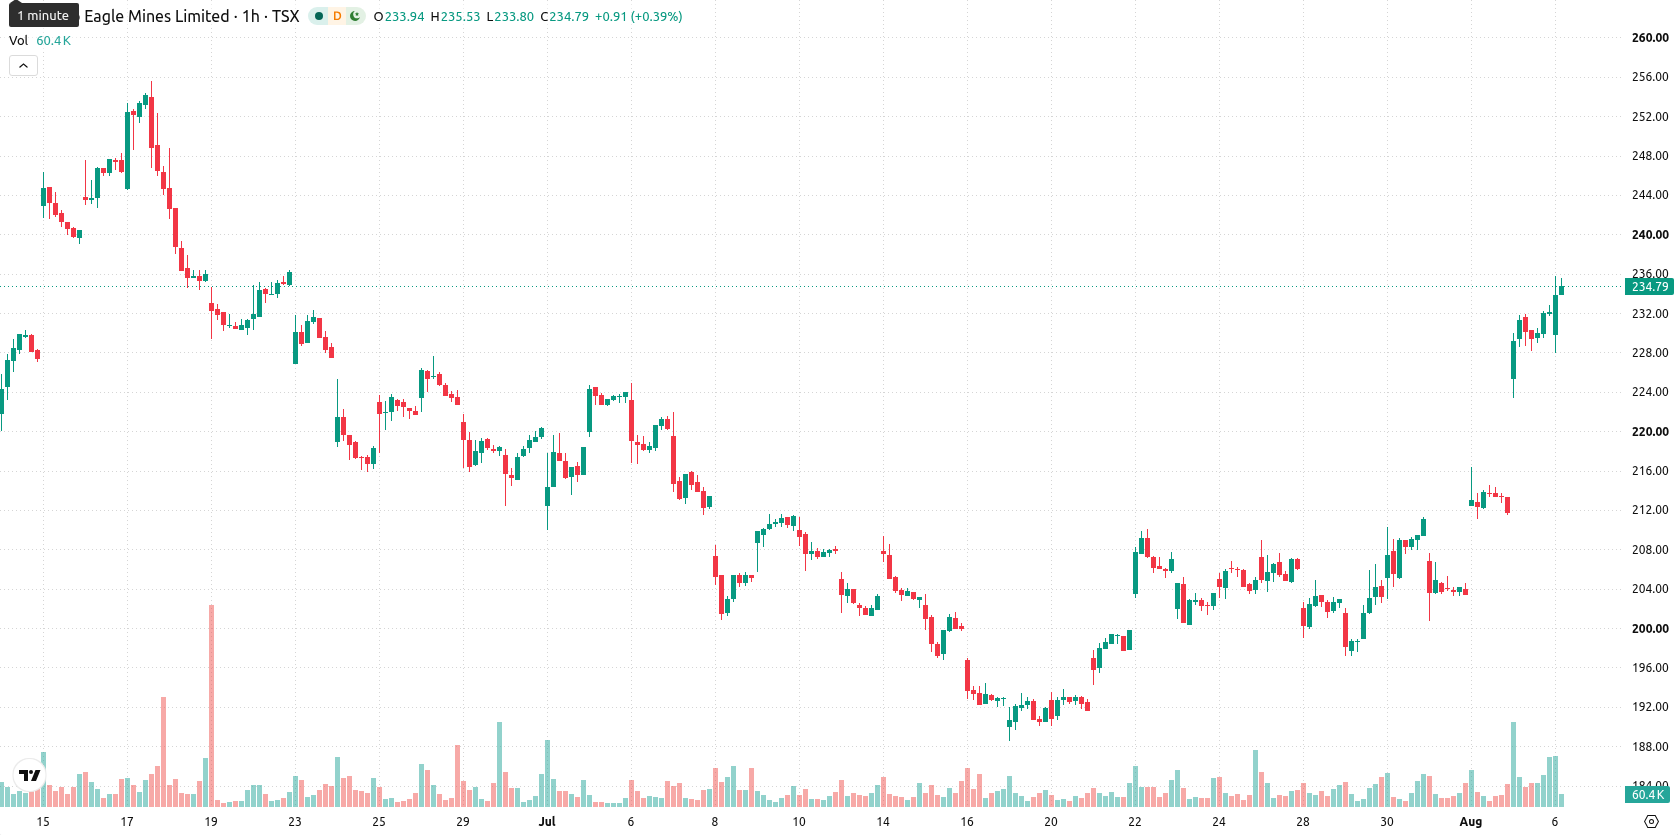
Bullish momentum persists as price sits above key supports and indicators strengthen
On the technical front, AEM is trading above the MA-20 hourly at C$217.73 and MA-50 at C$209.75, but remains below the longer-term MA-200 (C$253.35). Immediate support is marked by the Ichimoku Kijun at C$216.67. Momentum indicators confirm bullish conditions with both MACD and ADX positive, while RSI stands at an elevated 76.8, Stoch RSI is overbought, and CCI continues to signal a buy. Bull/Bear Power underscores dominant buying pressure intraday, though the Awesome Oscillator is neutral and does not highlight a specific direction.
Volatility range narrows as upward bias persists barring support breakdown
Looking ahead, the price is expected to fluctuate within the C$221.21 to C$249.61 range over the next 2–3 sessions. With a 75% probability assigned to continued upside, the base case is that AEM holds within this volatility band relative to current levels. In a bullish scenario, a break above resistance could set up a test of the upper range near C$249.61. Conversely, if immediate support near C$216.67 is breached, a deeper retracement toward the lower bound is likely.
Earlier, analysts noted that Agnico Eagle Mines exhibited generally bullish momentum but required fresh catalysts to sustain an upward move. The latest earnings beat and increased production guidance reinforce this outlook, with a decisive break above current resistance levels likely to determine the next directional move.










-
 Afghanistan
-
 Albania
-
 Algeria
-
 Angola
-
 Argentina
-
 Armenia
-
 Australia
-
 Austria
-
 Azerbaijan
-
 Bahamas
-
 Bahrain
-
 Bangladesh
-
 Belarus
-
 Belgium
-
 Bolivia
-
 Botswana
-
 Brazil
-
 Brunei
-
 Bulgaria
-
 Cambodia
-
 Cameroon
-
 Canada
-
 Chile
-
 China
-
 Colombia
-
 Congo
-
 Costa Rica
-
 Cote d'Ivoire
-
 Croatia
-
 Cuba
-
 Cyprus
-
 Czechia
-
 DR Congo
-
 Denmark
-
 Dominican Republic
-
 Ecuador
-
 Egypt
-
 El Salvador
-
 Estonia
-
 Eswatini
-
 Ethiopia
-
 Finland
-
 France
-
 Georgia
-
 Germany
-
 Ghana
-
 Greece
-
 Haiti
-
 Hong Kong
-
 Hungary
-
 India
-
 Indonesia
-
 Iran, Islamic republic
-
 Iraq
-
 Ireland
-
 Israel
-
 Italy
-
 Jamaica
-
 Japan
-
 Jordan
-
 Kazakhstan
-
 Kenya
-
 Korea
-
 Kuwait
-
 Kyrgyzstan
-
 Laos
-
 Latvia
-
 Lebanon
-
 Lesotho
-
 Libya
-
 Lithuania
-
 Luxembourg
-
 Madagascar
-
 Malaysia
-
 Malta
-
 Mauritius
-
 Mexico
-
 Moldova
-
 Mongolia
-
 Montenegro
-
 Morocco
-
 Mozambique
-
 Myanmar
-
 Namibia
-
 Nepal
-
 Netherlands
-
 New Zealand
-
 Nigeria
-
 North Macedonia
-
 Norway
-
 Oman
-
 Pakistan
-
 Palestine
-
 Panama
-
 Papua New Guinea
-
 Paraguay
-
 Peru
-
 Philippines
-
 Poland
-
 Portugal
-
 Puerto Rico
-
 Qatar
-
 Reunion
-
 Romania
-
 Rwanda
-
 Saudi Arabia
-
 Serbia
-
 Singapore
-
 Slovakia
-
 Slovenia
-
 Somalia
-
 South Africa
-
 Spain
-
 Sri Lanka
-
 Sweden
-
 Switzerland
-
 Syria
-
 Taiwan
-
 Tajikistan
-
 Tanzania
-
 Thailand
-
 Trinidad and Tobago
-
 Tunisia
-
 Turkey
-
 UAE
-
 Uganda
-
 Ukraine
-
 United Kingdom
-
United States
-
 Uruguay
-
 Uzbekistan
-
 Venezuela
-
 Vietnam
-
 Yemen
-
 Zambia
-
 Zimbabwe
- Forex
- Crypto












