

36-month $0-down device financing launch: TMUS resistance levels in focus

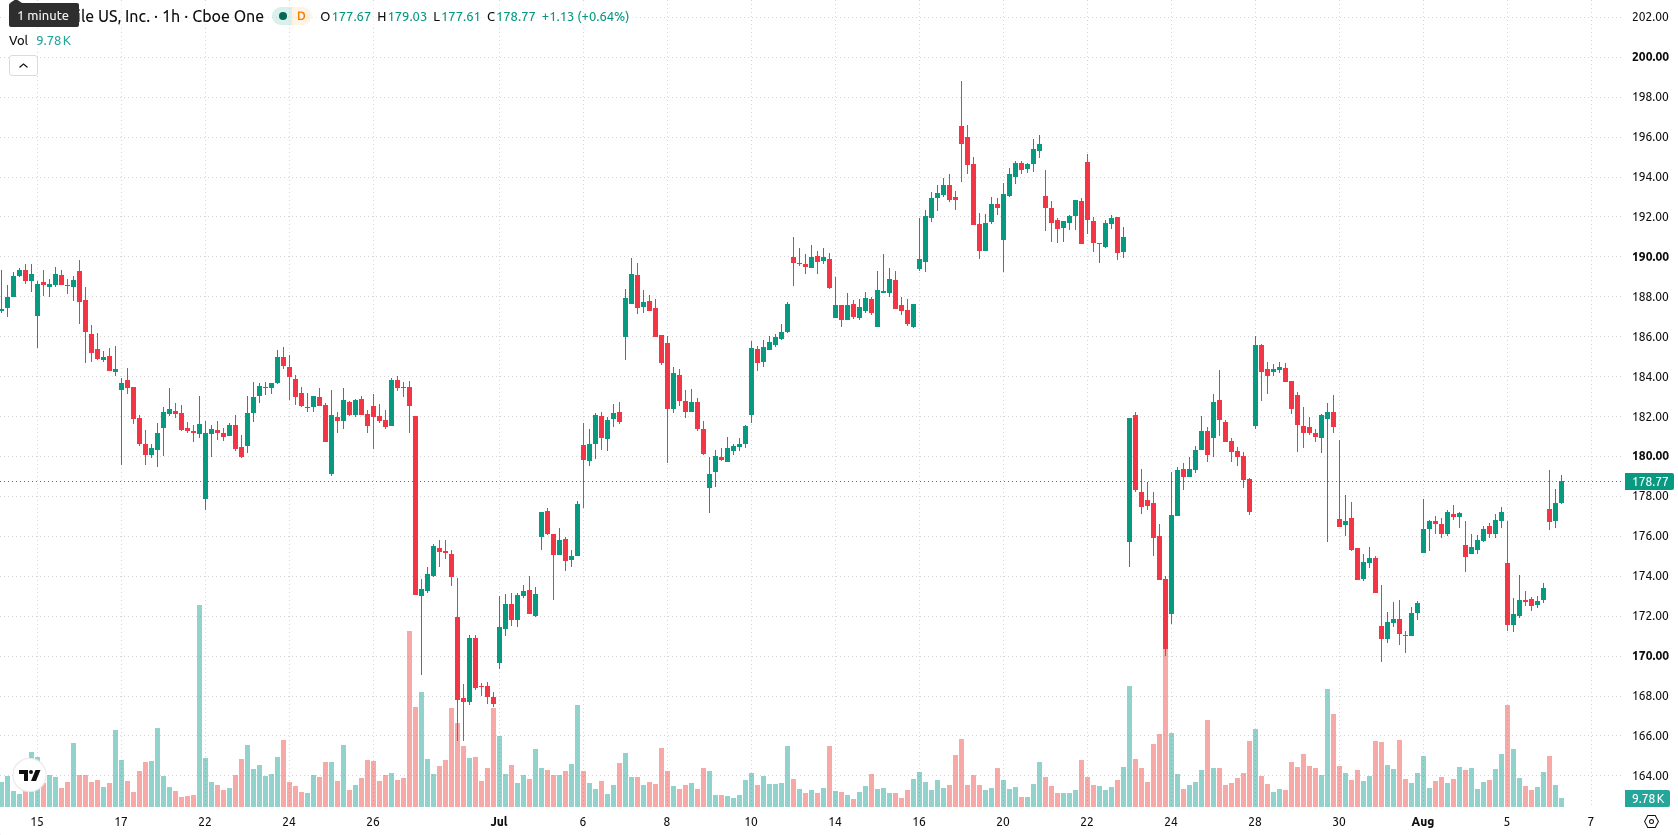
T-Mobile (TMUS) stock is trading at $178.94, up 3.17% for the session. The price is currently above its key moving averages on the short- and medium-term timeframes, while remaining below its long-term average.
 172.55
174.45
Highlights
- T-Mobile has launched a 36-month device financing plan with $0-down and bundled taxes, reducing monthly costs for qualified buyers.
- New payment options combined with updated postpaid and student plans aim to boost subscriber growth and retention amid higher phone prices.
- Shares of T-Mobile show short- and medium-term bullish momentum, with a forecasted trading range of $175.5 to $182.42 and 59% upside probability in the next two to three days.
Device financing shift and offers drive subscriber growth outlook
T-Mobile has introduced a 36-month device financing option that bundles taxes and fees into $0-down payments for qualified buyers, a move that directly lowers monthly costs and may stimulate subscriber growth and retention, according to Webpronews. This adjustment comes as rising phone prices and extended device lifecycles motivate customers to seek more affordable payment plans, encouraging greater uptake of new devices. The launch ties into refreshed postpaid plans and student discounts, enhancing T-Mobile’s competitive position in the wireless market. Together, these measures support increased demand as pricing flexibility and accessible offers attract new and recurring business.
Strength in momentum and support as long-term resistance holds
On the technical chart, TMUS is above its MA-20 and MA-50 but remains below MA-200, indicating a divergence between short-term strength and long-term resistance. The Ichimoku Kijun at $174.17 is acting as immediate support. Among momentum indicators, RSI and CCI are in clear buy territory while Stoch RSI and Bull/Bear Power signal overbought conditions, reinforcing strong intraday buying activity. ADX highlights ongoing buying strength, though MACD stands out with a strong sell signal, pointing to potential divergence, and the Awesome Oscillator continues to back the prevailing trend.
Upside breakout risk rises as consolidation tightens
Looking ahead over the next 2–3 days, TMUS is expected to remain within the $175.5–$182.42 range, indicating a period of consolidation. There is a higher probability of an upside breakout (59%) compared to downside risk (41%), suggesting buyers are in control and a reversal is less likely. The central scenario anticipates sideways trading within this volatility band, with a bullish outcome if price clears resistance or a bearish move if support at $174.17 is breached.
Earlier, analysts noted that T-Mobile faced a complex technical and competitive landscape, with consolidation likely amid downside risk despite new promotional initiatives. The current analysis marks a shift, highlighting short-term technical strength and suggesting that clearance of long-term resistance could open the way for further upside momentum, making the $182.42 resistance a key level to watch in the days ahead.






Latest T-Mobile News



-
 Afghanistan
-
 Albania
-
 Algeria
-
 Angola
-
 Argentina
-
 Armenia
-
 Australia
-
 Austria
-
 Azerbaijan
-
 Bahamas
-
 Bahrain
-
 Bangladesh
-
 Belarus
-
 Belgium
-
 Bolivia
-
 Botswana
-
 Brazil
-
 Brunei
-
 Bulgaria
-
 Cambodia
-
 Cameroon
-
 Canada
-
 Chile
-
 China
-
 Colombia
-
 Congo
-
 Costa Rica
-
 Cote d'Ivoire
-
 Croatia
-
 Cuba
-
 Cyprus
-
 Czechia
-
 DR Congo
-
 Denmark
-
 Dominican Republic
-
 Ecuador
-
 Egypt
-
 El Salvador
-
 Estonia
-
 Eswatini
-
 Ethiopia
-
 Finland
-
 France
-
 Georgia
-
 Germany
-
 Ghana
-
 Greece
-
 Haiti
-
 Hong Kong
-
 Hungary
-
 India
-
 Indonesia
-
 Iran, Islamic republic
-
 Iraq
-
 Ireland
-
 Israel
-
 Italy
-
 Jamaica
-
 Japan
-
 Jordan
-
 Kazakhstan
-
 Kenya
-
 Korea
-
 Kuwait
-
 Kyrgyzstan
-
 Laos
-
 Latvia
-
 Lebanon
-
 Lesotho
-
 Libya
-
 Lithuania
-
 Luxembourg
-
 Madagascar
-
 Malaysia
-
 Malta
-
 Mauritius
-
 Mexico
-
 Moldova
-
 Mongolia
-
 Montenegro
-
 Morocco
-
 Mozambique
-
 Myanmar
-
 Namibia
-
 Nepal
-
 Netherlands
-
 New Zealand
-
 Nigeria
-
 North Macedonia
-
 Norway
-
 Oman
-
 Pakistan
-
 Palestine
-
 Panama
-
 Papua New Guinea
-
 Paraguay
-
 Peru
-
 Philippines
-
 Poland
-
 Portugal
-
 Puerto Rico
-
 Qatar
-
 Reunion
-
 Romania
-
 Rwanda
-
 Saudi Arabia
-
 Serbia
-
 Singapore
-
 Slovakia
-
 Slovenia
-
 Somalia
-
 South Africa
-
 Spain
-
 Sri Lanka
-
 Sweden
-
 Switzerland
-
 Syria
-
 Taiwan
-
 Tajikistan
-
 Tanzania
-
 Thailand
-
 Trinidad and Tobago
-
 Tunisia
-
 Turkey
-
 UAE
-
 Uganda
-
 Ukraine
-
 United Kingdom
-
United States
-
 Uruguay
-
 Uzbekistan
-
 Venezuela
-
 Vietnam
-
 Yemen
-
 Zambia
-
 Zimbabwe
- Forex
- Crypto












