

Why is T-Mobile stock falling today? Starlink wireless entry and $166.9 support levels to watch

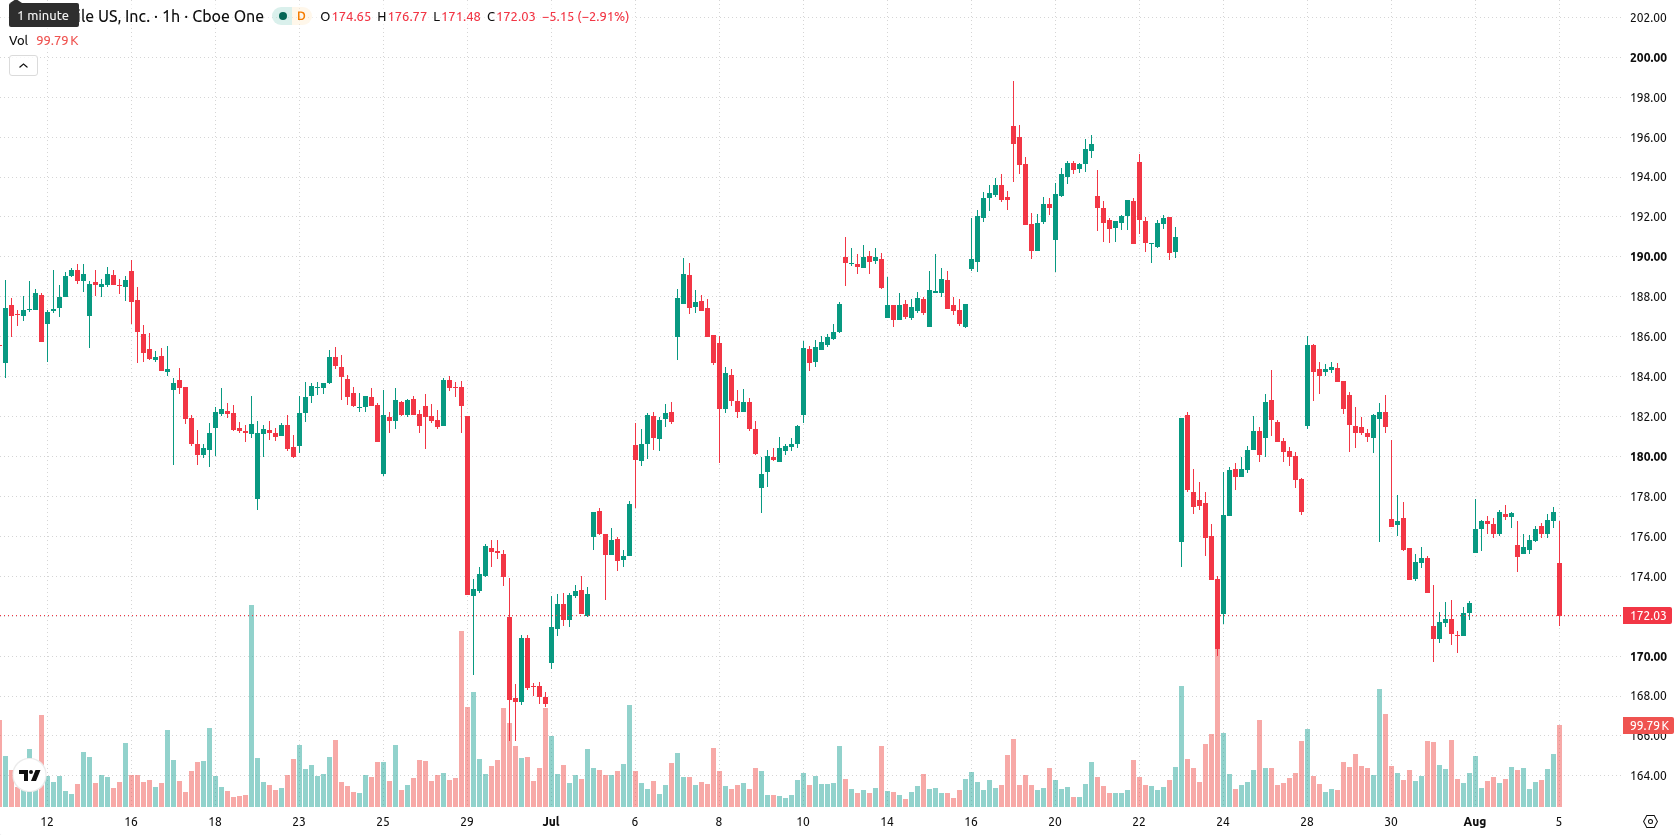
T-Mobile US (TMUS) stock is trading at $171.69, down 3.14% on the day. The price sits below its key moving averages, reflecting sustained selling pressure in recent sessions.
 158.97
150.70
Highlights
- T-Mobile US has introduced a 36-month EIP Flex 36 phone financing program to lower upfront costs and potentially boost upgrade activity.
- All new T-Mobile plans now require 36-month commitments, while competition risk grows with SpaceX revealing Starlink mobile service intentions for the US market.
- Shares of T-Mobile trade below major moving averages with a bearish technical outlook, and a 2 to 3 day range forecast of $166.9 to $176.48 reflects a 77% probability of further downside.
Financing shift and rival launches reshape upgrade demand and risk profile
T-Mobile US has introduced its EIP Flex 36 financing program, which allows customers to acquire new phones with no upfront cost by including taxes and fees in monthly payments over a 36-month period, according to Bloomberg. This move is intended to lower near-term spending thresholds and could drive increased phone upgrades and contract volumes, but a longer commitment extends payback periods and may impact profitability rhythm. Separately, T-Mobile has shifted its plans to new '2.0' versions now mandating 36-month terms, as reported by Cnet, while heightened competition concerns have emerged following SpaceX's announced plan to launch Starlink mobile services in the US, as noted by Marketscreener.
Neutral momentum and diverging signals as resistance strengthens
Technically, TMUS is trading below the MA-20 at $175.01, MA-50 at $177.96, and MA-200 at $198.56. The Ichimoku Kijun sits at $173.79 and acts as immediate resistance. Momentum readings indicate a neutral MACD and ADX, while the RSI is at 54.37 and the CCI is also showing a buy signal. Both Stoch RSI and Bull/Bear Power are positioned in overbought territory. The Awesome Oscillator confirms strong buy momentum, but diverging oscillators and persistent intraday weakness highlight a complex technical landscape with uncertainty for near-term directional bias.
Consolidation likely as downside risk dominates near term
Over the next two to three trading days, TMUS is expected to trade between $166.9 and $176.48, tracking within a typical volatility band relative to current levels. There is a 23% probability of an upward move and a 77% probability of further downside. The baseline scenario is for consolidation within this range; a bullish breakout would require a close above the immediate resistance level at $173.79, while downside risk increases meaningfully if support at $166.9 fails.
Earlier, analysts noted that T-Mobile US continued to face bearish technical pressure, with limited signs of a meaningful rebound despite new promotional offers. The introduction of EIP Flex 36 and evolving competitive dynamics further complicate the setup, making the key support at $166.9 especially critical for any shift in the short-term outlook.









-
 Afghanistan
-
 Albania
-
 Algeria
-
 Angola
-
 Argentina
-
 Armenia
-
 Australia
-
 Austria
-
 Azerbaijan
-
 Bahamas
-
 Bahrain
-
 Bangladesh
-
 Belarus
-
 Belgium
-
 Bolivia
-
 Botswana
-
 Brazil
-
 Brunei
-
 Bulgaria
-
 Cambodia
-
 Cameroon
-
 Canada
-
 Chile
-
 China
-
 Colombia
-
 Congo
-
 Costa Rica
-
 Cote d'Ivoire
-
 Croatia
-
 Cuba
-
 Cyprus
-
 Czechia
-
 DR Congo
-
 Denmark
-
 Dominican Republic
-
 Ecuador
-
 Egypt
-
 El Salvador
-
 Estonia
-
 Eswatini
-
 Ethiopia
-
 Finland
-
 France
-
 Georgia
-
 Germany
-
 Ghana
-
 Greece
-
 Haiti
-
 Hong Kong
-
 Hungary
-
 India
-
 Indonesia
-
 Iran, Islamic republic
-
 Iraq
-
 Ireland
-
 Israel
-
 Italy
-
 Jamaica
-
 Japan
-
 Jordan
-
 Kazakhstan
-
 Kenya
-
 Korea
-
 Kuwait
-
 Kyrgyzstan
-
 Laos
-
 Latvia
-
 Lebanon
-
 Lesotho
-
 Libya
-
 Lithuania
-
 Luxembourg
-
 Madagascar
-
 Malaysia
-
 Malta
-
 Mauritius
-
 Mexico
-
 Moldova
-
 Mongolia
-
 Montenegro
-
 Morocco
-
 Mozambique
-
 Myanmar
-
 Namibia
-
 Nepal
-
 Netherlands
-
 New Zealand
-
 Nigeria
-
 North Macedonia
-
 Norway
-
 Oman
-
 Pakistan
-
 Palestine
-
 Panama
-
 Papua New Guinea
-
 Paraguay
-
 Peru
-
 Philippines
-
 Poland
-
 Portugal
-
 Puerto Rico
-
 Qatar
-
 Reunion
-
 Romania
-
 Rwanda
-
 Saudi Arabia
-
 Serbia
-
 Singapore
-
 Slovakia
-
 Slovenia
-
 Somalia
-
 South Africa
-
 Spain
-
 Sri Lanka
-
 Sweden
-
 Switzerland
-
 Syria
-
 Taiwan
-
 Tajikistan
-
 Tanzania
-
 Thailand
-
 Trinidad and Tobago
-
 Tunisia
-
 Turkey
-
 UAE
-
 Uganda
-
 Ukraine
-
 United Kingdom
-
United States
-
 Uruguay
-
 Uzbekistan
-
 Venezuela
-
 Vietnam
-
 Yemen
-
 Zambia
-
 Zimbabwe
- Forex
- Crypto












