

Why is UiPath stock rising today? Q2 FY2027 earnings report and breakout setup

UiPath Inc. (PATH) stock is trading at $14.77, posting a daily gain of 5.5%. The price is above its key short-, medium-, and long-term moving averages, indicating sustained upward momentum in the current session.
 13.03
13.44
Highlights
- UiPath will report second quarter fiscal 2027 results after market close on September 3, 2026, attracting investor focus.
- Anticipation of possible financial performance shifts ahead of earnings is driving increased position adjustments and heightened trading activity.
- PATH/USD shows strong bullish momentum with key technical support in place; price is expected to range from $14.09 to $15.45, but overbought signals warn of short-term pullback risk.
Investor positioning intensifies as earnings date draws market focus
UiPath has announced it will report its second quarter fiscal 2027 financial results, covering the period ended July 31, 2026, after market close on September 3, 2026, according to Business Wire. The upcoming earnings report draws market attention and encourages investors to adjust their positions in anticipation of potential financial performance disclosures. This kind of scheduled event generally leads to heightened trading activity, as market participants seek exposure ahead of possible changes in outlook or momentum tied to the company’s results.
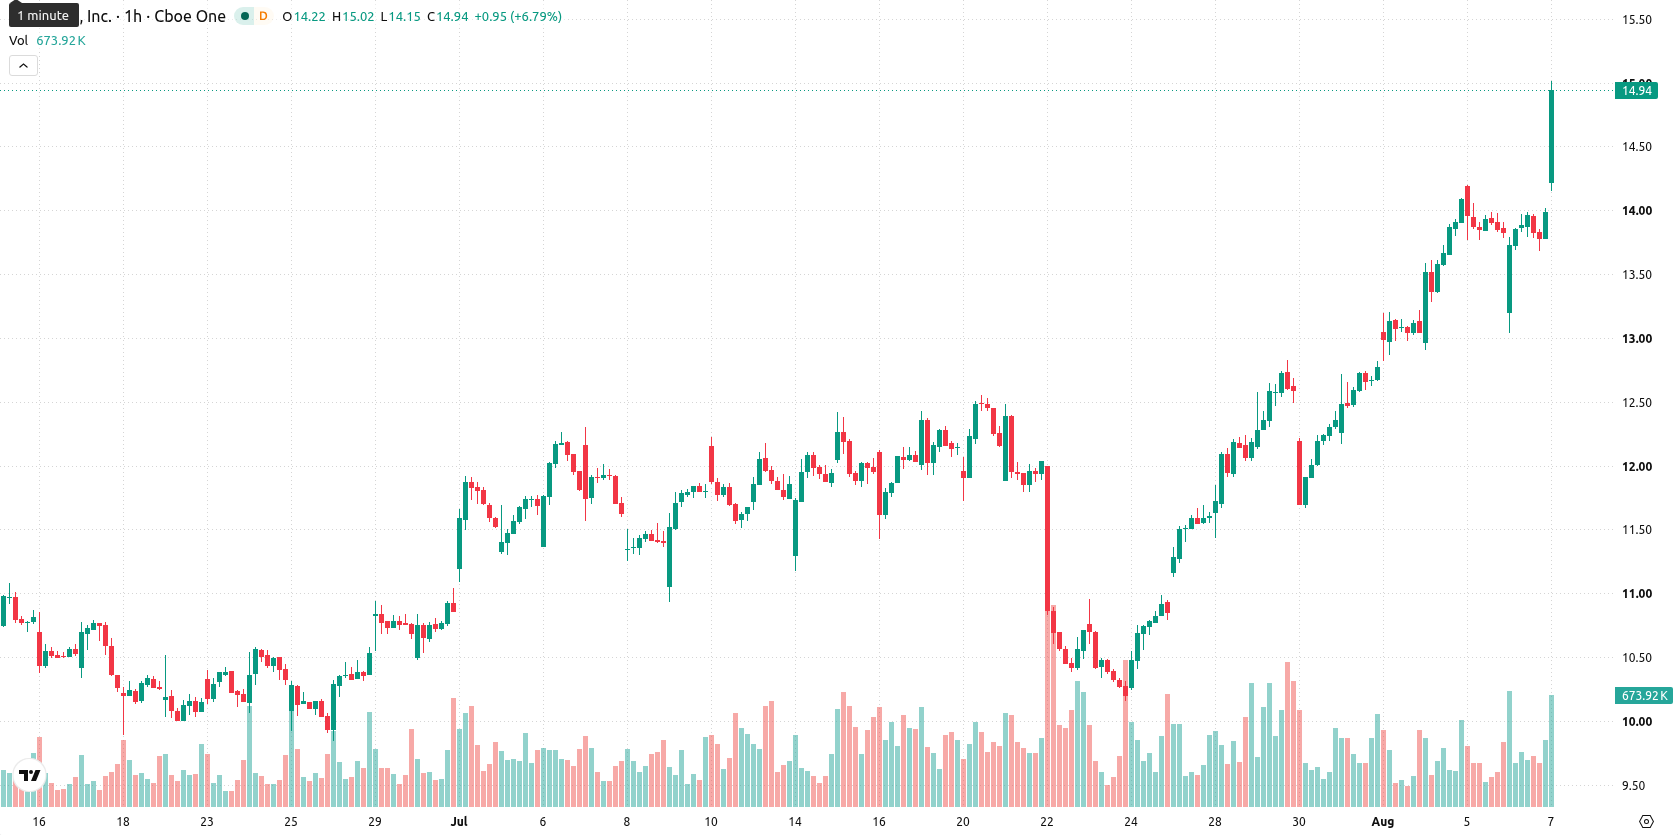
Bullish momentum dominates as multiple indicators flag overbought risk
On the technical front, the price is trading above the MA-20 at $13.9, MA-50 at $13.14, and MA-200 at $12.74, with the Ichimoku Kijun at $13.87 providing immediate support. Momentum indicators remain primarily bullish: MACD and ADX reflect ongoing buying strength, while RSI holds at 77.35 and signals overbought conditions. Stoch RSI, CCI, and Bull/Bear Power also indicate an overbought market, highlighting strong buyer dominance but raising caution for a possible pullback. The Awesome Oscillator is neutral, offering no additional confirmation for the prevailing trend, while high session volatility and a positive gap further underscore the robust but potentially exhausted rally.
Price consolidation favored as volatility bands frame breakout potential
Looking ahead, PATH is expected to trade within the $14.09 to $15.45 volatility band over the next several sessions. There is a 79% probability of an upward move, with downside less likely at 21%. The baseline scenario points to price consolidation between established support and resistance; a breakout above $15.45 would open the door for further gains, while a decline below $14.09 would confirm a reversal toward lower levels.
Earlier, analysts noted that while UiPath’s stock was supported by bullish technical momentum, signs of overbought conditions suggested potential for short-term consolidation or a corrective move. With continued buying strength now reinforced ahead of the upcoming earnings report, traders should closely monitor the $14.09 support and $15.45 resistance levels for indication of the next decisive breakout or reversal.










-
 Afghanistan
-
 Albania
-
 Algeria
-
 Angola
-
 Argentina
-
 Armenia
-
 Australia
-
 Austria
-
 Azerbaijan
-
 Bahamas
-
 Bahrain
-
 Bangladesh
-
 Belarus
-
 Belgium
-
 Bolivia
-
 Botswana
-
 Brazil
-
 Brunei
-
 Bulgaria
-
 Cambodia
-
 Cameroon
-
 Canada
-
 Chile
-
 China
-
 Colombia
-
 Congo
-
 Costa Rica
-
 Cote d'Ivoire
-
 Croatia
-
 Cuba
-
 Cyprus
-
 Czechia
-
 DR Congo
-
 Denmark
-
 Dominican Republic
-
 Ecuador
-
 Egypt
-
 El Salvador
-
 Estonia
-
 Eswatini
-
 Ethiopia
-
 Finland
-
 France
-
 Georgia
-
 Germany
-
 Ghana
-
 Greece
-
 Haiti
-
 Hong Kong
-
 Hungary
-
 India
-
 Indonesia
-
 Iran, Islamic republic
-
 Iraq
-
 Ireland
-
 Israel
-
 Italy
-
 Jamaica
-
 Japan
-
 Jordan
-
 Kazakhstan
-
 Kenya
-
 Korea
-
 Kuwait
-
 Kyrgyzstan
-
 Laos
-
 Latvia
-
 Lebanon
-
 Lesotho
-
 Libya
-
 Lithuania
-
 Luxembourg
-
 Madagascar
-
 Malaysia
-
 Malta
-
 Mauritius
-
 Mexico
-
 Moldova
-
 Mongolia
-
 Montenegro
-
 Morocco
-
 Mozambique
-
 Myanmar
-
 Namibia
-
 Nepal
-
 Netherlands
-
 New Zealand
-
 Nigeria
-
 North Macedonia
-
 Norway
-
 Oman
-
 Pakistan
-
 Palestine
-
 Panama
-
 Papua New Guinea
-
 Paraguay
-
 Peru
-
 Philippines
-
 Poland
-
 Portugal
-
 Puerto Rico
-
 Qatar
-
 Reunion
-
 Romania
-
 Rwanda
-
 Saudi Arabia
-
 Serbia
-
 Singapore
-
 Slovakia
-
 Slovenia
-
 Somalia
-
 South Africa
-
 Spain
-
 Sri Lanka
-
 Sweden
-
 Switzerland
-
 Syria
-
 Taiwan
-
 Tajikistan
-
 Tanzania
-
 Thailand
-
 Trinidad and Tobago
-
 Tunisia
-
 Turkey
-
 UAE
-
 Uganda
-
 Ukraine
-
 United Kingdom
-
United States
-
 Uruguay
-
 Uzbekistan
-
 Venezuela
-
 Vietnam
-
 Yemen
-
 Zambia
-
 Zimbabwe
- Forex
- Crypto












