

Verizon stock weekly forecast: Recovery continues with MACD confirming bullish signal

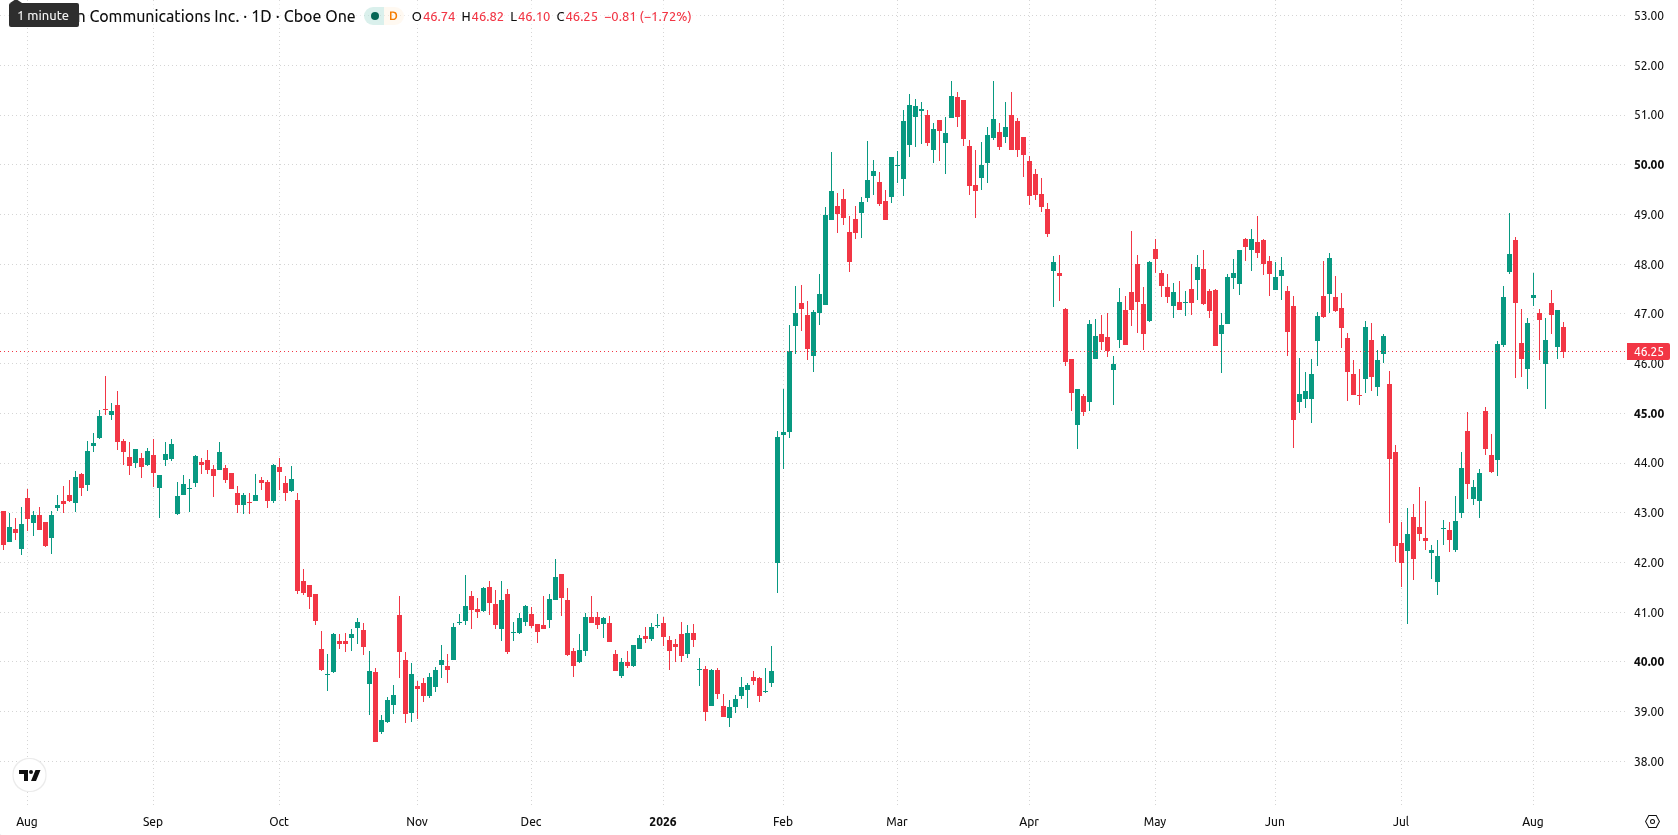
Shares of Verizon Communications Inc. (VZ) are trading near $46, coming off a decline of nearly 2% this week as the stock extends its recovery despite some overbought pressure building. The outlook for the week ahead is shaped by continued momentum but also an increased risk of buyers pausing as technical warning signs mount.
 46.35
46.97
Highlights
- Shares of Verizon have remained above key moving averages, indicating a strong bullish structure despite a 1.71% pullback over the past week.
- MACD issues a buy signal and volatility is contained, while overbought conditions reflect ongoing buyer control with some caution warranted.
- The near-term trading range is projected at $45.16 to $47.6, with a very high probability of bullish consolidation and a break above $47.48 signaling further upside.
Earnings beat and corporate deals lift sentiment amid network restoration
Verizon reported quarterly earnings that beat market estimates, which Morningstar and Kalkine Media highlighted as a key driver supporting sentiment into this week. Morningstar also noted improved subscriber retention and solid dividend funding, while Gurufocus said Verizon restored service in Southern California after a major outage caused by vandalized fiber lines. Yahoo Finance pointed to a new partnership with Fi Inc., adding the Fi Mini pet tracker to the Verizon Family app, while Kalkine Media cited lower Treasury yields as a supportive factor for capital-intensive dividend names like Verizon.
Technical support holds as upward signals offset overbought caution this week
The daily chart shows the stock is holding its ground with volatility running at 5.3%, highlighting a contained move within a narrow range. The MACD supports an upward view with a "Buy" signal, while Bull/Bear Power shows an overbought condition, suggesting buyers remain in control but with some caution warranted. Nearest support comes in at $45.39, while resistance aligns with last week's high at $47.48; $44.9 on the Ichimoku Kijun also offers practical downside protection. With the broader structure buoyed by these levels, price action should remain constructive in the near term.
Upward bias prevails as range-bound breakout risk looms next week
Over the coming trading week, the expected range sits between $45.16 and $47.6. There is a very high probability (more than 80%) of an increase and a very low probability (less than 20%) of a decrease. The base case favors consolidation inside this range, with upward momentum likely to dominate. A break above $47.48 would open a bullish scenario and signal renewed strength, while any breakdown below $45.39 could allow for a brief move lower toward the lower end of the projected range.
Earlier, analysts noted that Verizon’s shares were maintaining a constructive technical profile, with buyers controlling the trend barring a decisive breakdown. The latest weekly action introduces increased caution as overbought signals and resistance near recent highs sharpen focus on whether buyers can defend the $45.39 support to avoid a potential fade lower.









-
 Afghanistan
-
 Albania
-
 Algeria
-
 Angola
-
 Argentina
-
 Armenia
-
 Australia
-
 Austria
-
 Azerbaijan
-
 Bahamas
-
 Bahrain
-
 Bangladesh
-
 Belarus
-
 Belgium
-
 Bolivia
-
 Botswana
-
 Brazil
-
 Brunei
-
 Bulgaria
-
 Cambodia
-
 Cameroon
-
 Canada
-
 Chile
-
 China
-
 Colombia
-
 Congo
-
 Costa Rica
-
 Cote d'Ivoire
-
 Croatia
-
 Cuba
-
 Cyprus
-
 Czechia
-
 DR Congo
-
 Denmark
-
 Dominican Republic
-
 Ecuador
-
 Egypt
-
 El Salvador
-
 Estonia
-
 Eswatini
-
 Ethiopia
-
 Finland
-
 France
-
 Georgia
-
 Germany
-
 Ghana
-
 Greece
-
 Haiti
-
 Hong Kong
-
 Hungary
-
 India
-
 Indonesia
-
 Iran, Islamic republic
-
 Iraq
-
 Ireland
-
 Israel
-
 Italy
-
 Jamaica
-
 Japan
-
 Jordan
-
 Kazakhstan
-
 Kenya
-
 Korea
-
 Kuwait
-
 Kyrgyzstan
-
 Laos
-
 Latvia
-
 Lebanon
-
 Lesotho
-
 Libya
-
 Lithuania
-
 Luxembourg
-
 Madagascar
-
 Malaysia
-
 Malta
-
 Mauritius
-
 Mexico
-
 Moldova
-
 Mongolia
-
 Montenegro
-
 Morocco
-
 Mozambique
-
 Myanmar
-
 Namibia
-
 Nepal
-
 Netherlands
-
 New Zealand
-
 Nigeria
-
 North Macedonia
-
 Norway
-
 Oman
-
 Pakistan
-
 Palestine
-
 Panama
-
 Papua New Guinea
-
 Paraguay
-
 Peru
-
 Philippines
-
 Poland
-
 Portugal
-
 Puerto Rico
-
 Qatar
-
 Reunion
-
 Romania
-
 Rwanda
-
 Saudi Arabia
-
 Serbia
-
 Singapore
-
 Slovakia
-
 Slovenia
-
 Somalia
-
 South Africa
-
 Spain
-
 Sri Lanka
-
 Sweden
-
 Switzerland
-
 Syria
-
 Taiwan
-
 Tajikistan
-
 Tanzania
-
 Thailand
-
 Trinidad and Tobago
-
 Tunisia
-
 Turkey
-
 UAE
-
 Uganda
-
 Ukraine
-
 United Kingdom
-
United States
-
 Uruguay
-
 Uzbekistan
-
 Venezuela
-
 Vietnam
-
 Yemen
-
 Zambia
-
 Zimbabwe
- Forex
- Crypto












