

Verizon stock holds gains near support at $46.61 amid volatile stretch: weekly analysis

Shares of Verizon Communications Inc. (VZ) are trading near $46.8 after gaining a little more than 2% over the past week, as the stock approaches the upper edge of a tightly defined range. While momentum remains mixed, overbought signals are flashing and hint at a potential pause or reversal. Traders will be watching for consolidation or any break from current technical boundaries in the days ahead.
 46.89
47.15
Highlights
- Shares of Verizon rose $1.1 over the past 7 days to $46.8, holding above short-term averages but capped below longer-term resistance.
- Technical indicators register in the overbought zone, flagging increased risk for correction as price consolidates within a narrow recent range.
- For the next five trading days, Verizon shares are projected to trade between $46.29 and $50.37, with base-case consolidation near $46.61 support and $47.08 resistance.
Debt redemption and strong postpaid gains bolster sentiment this week
Verizon announced that it will redeem certain debt securities on December 23, 2026, highlighting ongoing efforts to manage its capital structure, according to GlobeNewswire. In recent days, several outlets including Yahoo Finance have noted the company's substantial dividend yield of around 6.1% to 6.2%, supported by robust free cash flow and coverage despite significant debt levels. Verizon also reported substantial growth in postpaid phone net additions during the third quarter, its strongest Q3 result in five years, as the company continues to emphasize wireless service revenue growth in its earnings call.
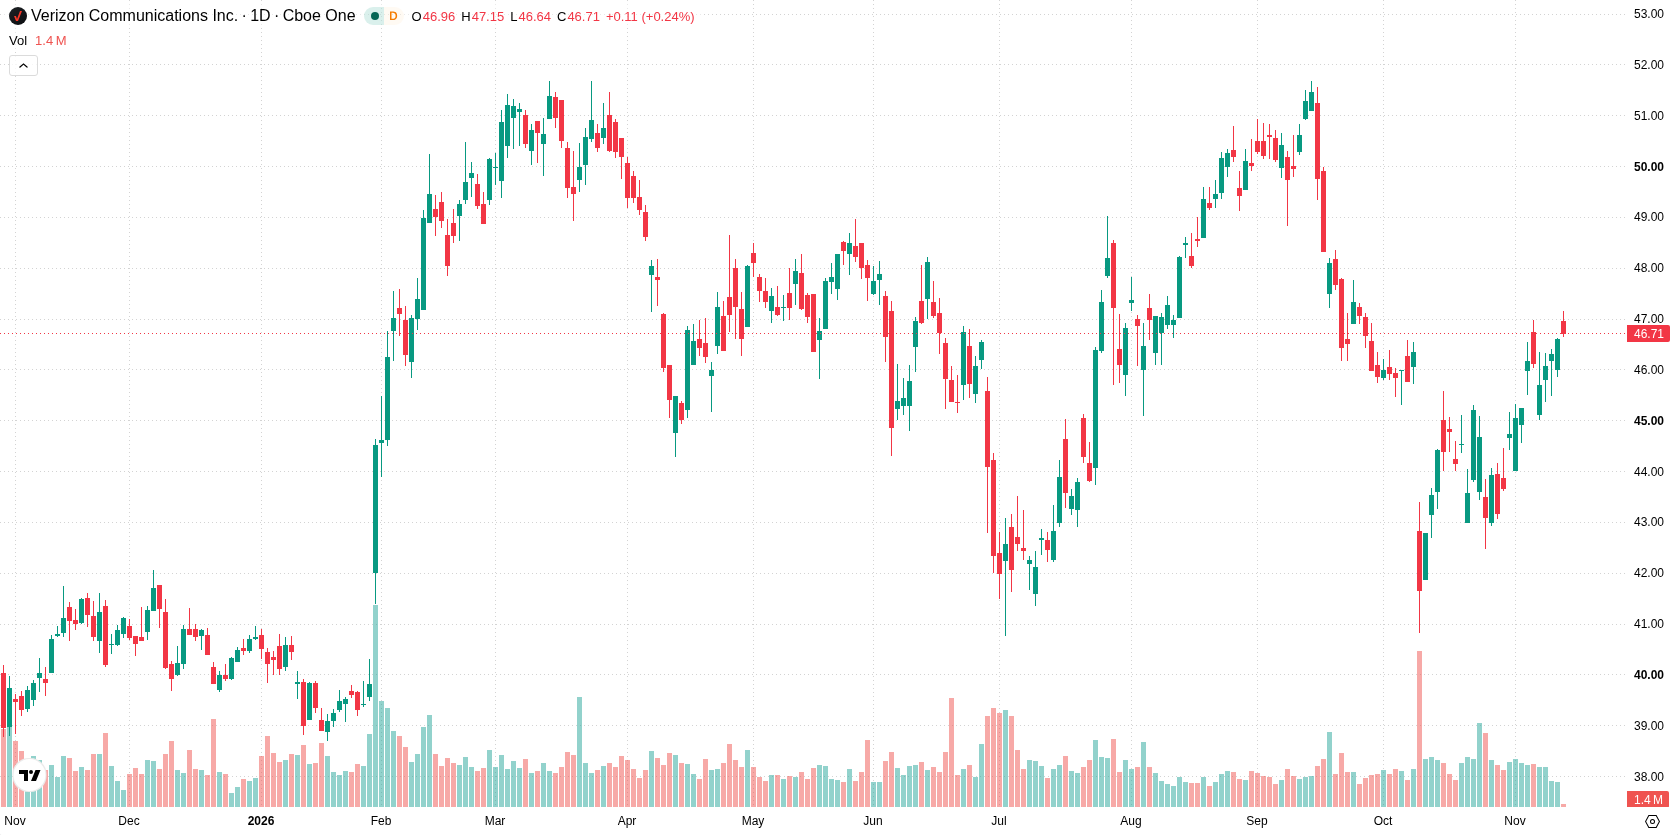
Indicator overextension highlights downside risk as week closes near resistance
The daily chart shows consolidation inside a contained move within a narrow range, with volatility over the past week at 2.48%. Stochastic RSI and CCI both register in the overbought zone (Stoch RSI at 100), flagging potential correction risk, even as overall momentum readings remain mixed. Immediate support is marked at $46.61, the weekly high, with resistance at the 200-day average of $47.08. The current mix suggests the stock is testing the upper end of its recent range, but indicator overextension points to possible downside risk.
Consolidation likely next week unless price breaks above key resistance
For the next five trading days, Verizon shares are expected to trade between $46.29 and $50.37. There is a 74% probability of an increase and a 26% probability of a decrease. The base case is for continued consolidation around current levels, contained between support at $46.61 and resistance at $47.08. A sustained break above $47.08 would open the way for a move toward the upper end of the projected range. A drop below support at $46.61 would increase risk for a pullback toward the lower boundary near $46.29.
Earlier, analysts noted that Verizon’s technical setup presented both breakout potential and downside risk amid shareholder-focused financial initiatives. The current analysis adds new evidence of ongoing consolidation alongside overbought readings, highlighting $47.08 as the critical resistance level to monitor for any sustained directional move.









-
 Afghanistan
-
 Albania
-
 Algeria
-
 Angola
-
 Argentina
-
 Armenia
-
 Australia
-
 Austria
-
 Azerbaijan
-
 Bahamas
-
 Bahrain
-
 Bangladesh
-
 Belarus
-
 Belgium
-
 Bolivia
-
 Botswana
-
 Brazil
-
 Brunei
-
 Bulgaria
-
 Cambodia
-
 Cameroon
-
 Canada
-
 Chile
-
 China
-
 Colombia
-
 Congo
-
 Costa Rica
-
 Cote d'Ivoire
-
 Croatia
-
 Cuba
-
 Cyprus
-
 Czechia
-
 DR Congo
-
 Denmark
-
 Dominican Republic
-
 Ecuador
-
 Egypt
-
 El Salvador
-
 Estonia
-
 Eswatini
-
 Ethiopia
-
 Finland
-
 France
-
 Georgia
-
 Germany
-
 Ghana
-
 Greece
-
 Haiti
-
 Hong Kong
-
 Hungary
-
 India
-
 Indonesia
-
 Iran, Islamic republic
-
 Iraq
-
 Ireland
-
 Israel
-
 Italy
-
 Jamaica
-
 Japan
-
 Jordan
-
 Kazakhstan
-
 Kenya
-
 Korea
-
 Kuwait
-
 Kyrgyzstan
-
 Laos
-
 Latvia
-
 Lebanon
-
 Lesotho
-
 Libya
-
 Lithuania
-
 Luxembourg
-
 Madagascar
-
 Malaysia
-
 Malta
-
 Mauritius
-
 Mexico
-
 Moldova
-
 Mongolia
-
 Montenegro
-
 Morocco
-
 Mozambique
-
 Myanmar
-
 Namibia
-
 Nepal
-
 Netherlands
-
 New Zealand
-
 Nigeria
-
 North Macedonia
-
 Norway
-
 Oman
-
 Pakistan
-
 Palestine
-
 Panama
-
 Papua New Guinea
-
 Paraguay
-
 Peru
-
 Philippines
-
 Poland
-
 Portugal
-
 Puerto Rico
-
 Qatar
-
 Reunion
-
 Romania
-
 Rwanda
-
 Saudi Arabia
-
 Serbia
-
 Singapore
-
 Slovakia
-
 Slovenia
-
 Somalia
-
 South Africa
-
 Spain
-
 Sri Lanka
-
 Sweden
-
 Switzerland
-
 Syria
-
 Taiwan
-
 Tajikistan
-
 Tanzania
-
 Thailand
-
 Trinidad and Tobago
-
 Tunisia
-
 Turkey
-
 UAE
-
 Uganda
-
 Ukraine
-
 United Kingdom
-
United States
-
 Uruguay
-
 Uzbekistan
-
 Venezuela
-
 Vietnam
-
 Yemen
-
 Zambia
-
 Zimbabwe
- Forex
- Crypto












