

Verizon debt repurchase and earnings: Can VZ sustain its rally?

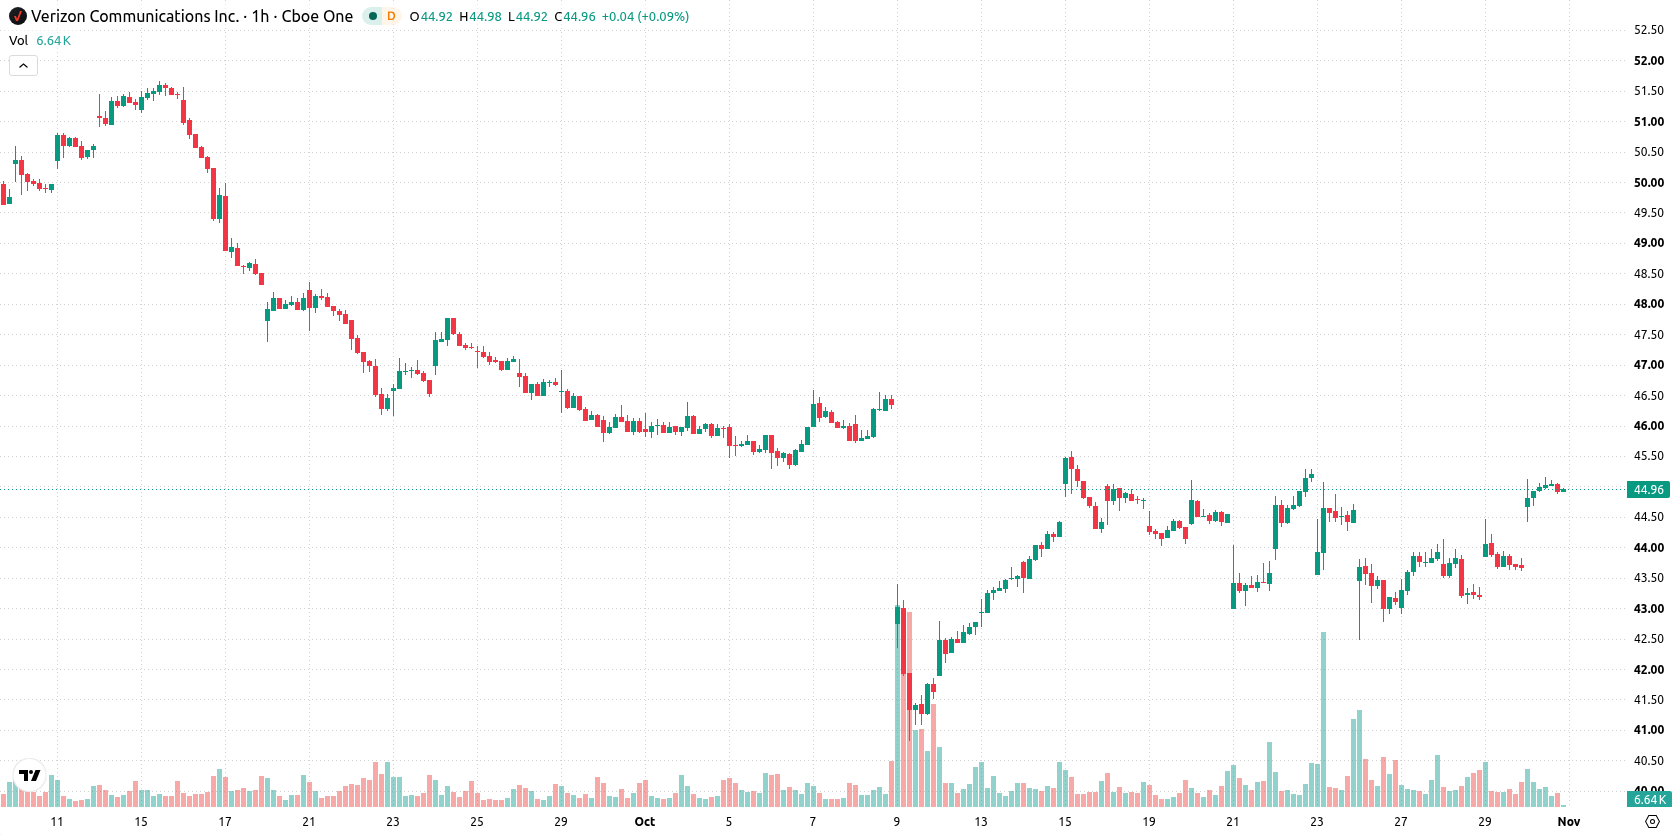
Verizon (VZ) stock is trading at $44.88, up 2.79% on the day. The stock sits above its short- and medium-term moving averages, while remaining below longer-term trend gauges.
 45.16
45.16
Highlights
- Verizon has launched cash tender offers to repurchase up to $500 million of debt, aiming to optimize its capital structure.
- The company reported third-quarter revenue of $34.31 billion, net income of $5.2 billion, and a 6.8% increase in EPS.
- Shares of Verizon rose 2.79% to $44.88, trading in a short- to medium-term bullish range with key support at $44.01 and an expected range of $44.12 to $46.36 over the next two to three days.
Debt repurchase and earnings growth fuel bullish sentiment
Verizon Communications Inc. has initiated five cash tender offers to repurchase up to $500 million of its outstanding notes, an action that directly enhances its capital structure and can boost financial flexibility, according to Globenewswire. This debt repurchase program is likely drawing investor interest by reducing future interest obligations and signaling management’s focus on balance sheet optimization. The company has also reported solid third-quarter growth, with revenue rising to $34.31 billion, net income reaching $5.2 billion, and EPS stepping up by 6.8%, as reported by TradingView. These combined developments create a constructive fundamental backdrop for current bullish sentiment.
Strong momentum as price tests critical technical thresholds
Technically, VZ has breached key short- and medium-term barriers, with the stock currently above the MA-20 at $43.84 and the MA-50 at $43.94, while still remaining beneath the MA-200 at $46.79. The Ichimoku Kijun at $44.01 provides immediate support, and should the price dip, this level could attract renewed buying interest. Momentum remains strong: RSI stands at 67.17 (Buy), MACD and ADX both confirm the prevailing bullish undertone, while Stoch RSI, CCI, and Bull/Bear Power all reflect robust buyer dominance and overbought conditions. The Awesome Oscillator continues to align with the ongoing upward trajectory.
Bullish consolidation favored barring a breakdown below support
Looking ahead to the next two to three sessions, trading is expected to remain within a volatility band of $44.12 to $46.36. With a 79% probability of continued upward movement, the base case scenario favors ongoing consolidation within this range. A sustained push above resistance would suggest a bullish extension, while a decisive drop below the Ichimoku Kijun support could trigger a corrective phase in the near term.
Previously it was reported that Verizon’s balance sheet management actions and persistent technical challenges kept the outlook cautious despite some short-term gains. The current analysis adds weight to this view by highlighting improving technical signals and solid quarterly fundamentals, with a move above $46.36 likely to confirm bullish momentum, while any sustained decline below the Ichimoku Kijun at $44.01 could spur corrective pressure over the near term.









-
 Afghanistan
-
 Albania
-
 Algeria
-
 Angola
-
 Argentina
-
 Armenia
-
 Australia
-
 Austria
-
 Azerbaijan
-
 Bahamas
-
 Bahrain
-
 Bangladesh
-
 Belarus
-
 Belgium
-
 Bolivia
-
 Botswana
-
 Brazil
-
 Brunei
-
 Bulgaria
-
 Cambodia
-
 Cameroon
-
 Canada
-
 Chile
-
 China
-
 Colombia
-
 Congo
-
 Costa Rica
-
 Cote d'Ivoire
-
 Croatia
-
 Cuba
-
 Cyprus
-
 Czechia
-
 DR Congo
-
 Denmark
-
 Dominican Republic
-
 Ecuador
-
 Egypt
-
 El Salvador
-
 Estonia
-
 Eswatini
-
 Ethiopia
-
 Finland
-
 France
-
 Georgia
-
 Germany
-
 Ghana
-
 Greece
-
 Haiti
-
 Hong Kong
-
 Hungary
-
 India
-
 Indonesia
-
 Iran, Islamic republic
-
 Iraq
-
 Ireland
-
 Israel
-
 Italy
-
 Jamaica
-
 Japan
-
 Jordan
-
 Kazakhstan
-
 Kenya
-
 Korea
-
 Kuwait
-
 Kyrgyzstan
-
 Laos
-
 Latvia
-
 Lebanon
-
 Lesotho
-
 Libya
-
 Lithuania
-
 Luxembourg
-
 Madagascar
-
 Malaysia
-
 Malta
-
 Mauritius
-
 Mexico
-
 Moldova
-
 Mongolia
-
 Montenegro
-
 Morocco
-
 Mozambique
-
 Myanmar
-
 Namibia
-
 Nepal
-
 Netherlands
-
 New Zealand
-
 Nigeria
-
 North Macedonia
-
 Norway
-
 Oman
-
 Pakistan
-
 Palestine
-
 Panama
-
 Papua New Guinea
-
 Paraguay
-
 Peru
-
 Philippines
-
 Poland
-
 Portugal
-
 Puerto Rico
-
 Qatar
-
 Reunion
-
 Romania
-
 Rwanda
-
 Saudi Arabia
-
 Serbia
-
 Singapore
-
 Slovakia
-
 Slovenia
-
 Somalia
-
 South Africa
-
 Spain
-
 Sri Lanka
-
 Sweden
-
 Switzerland
-
 Syria
-
 Taiwan
-
 Tajikistan
-
 Tanzania
-
 Thailand
-
 Trinidad and Tobago
-
 Tunisia
-
 Turkey
-
 UAE
-
 Uganda
-
 Ukraine
-
 United Kingdom
-
United States
-
 Uruguay
-
 Uzbekistan
-
 Venezuela
-
 Vietnam
-
 Yemen
-
 Zambia
-
 Zimbabwe
- Forex
- Crypto












