

Duke Energy stock support test at $119.37: Downside targets to watch

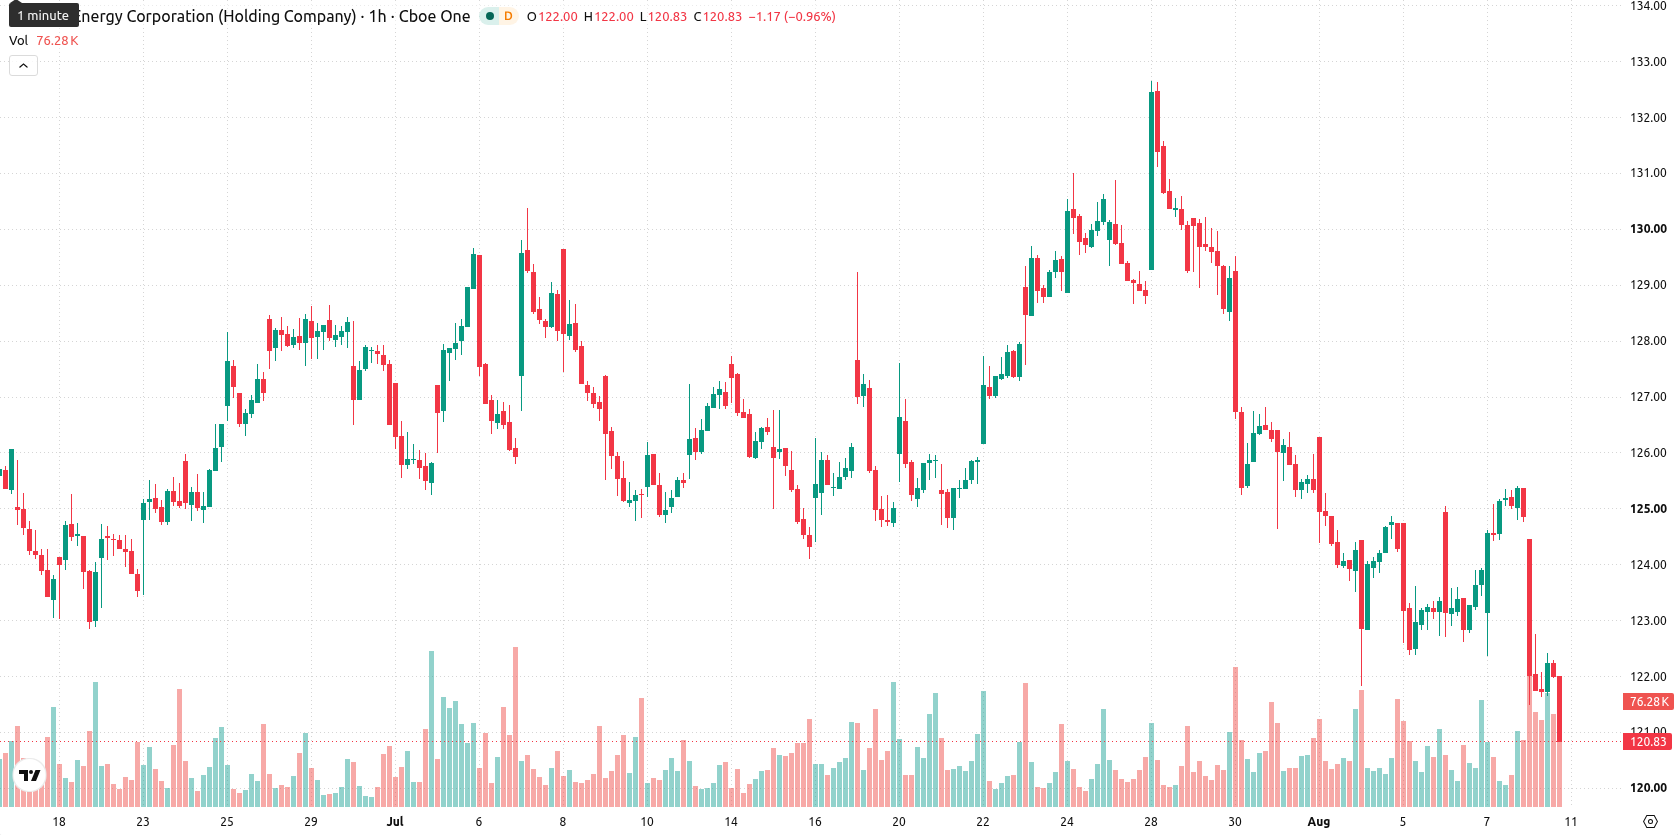
Duke Energy (DUK) stock is trading at $120.97, marking a daily decline of 3.11%. Shares are positioned below their key moving averages, reflecting continued selling momentum across all trend horizons.
 121.18
121.60
Highlights
- Duke Energy stock stands out for its unbroken dividend payment record, reinforcing its image as a stable income provider.
- Despite its commitment to shareholder rewards, Duke Energy shares remain under pressure from broader market selling.
- Technically, the stock trades below key moving averages with bearish momentum, likely to consolidate between $119.37 to $122.57 in coming days.
Dividend consistency contrasts with persistent selling pressure
Duke Energy has maintained an unbroken record of dividend payments, ranking as one of just three energy companies never to have reduced its payout, according to Finance Yahoo. This history underscores management's consistent approach to rewarding shareholders, supporting the company's image as a stable income provider. While this policy may contribute to steady investor interest, price action has remained under broader selling pressure.
Downside momentum prevails as technicals remain bearish
On the technical front, DUK is trading below the MA-20 and MA-50 on the working timeframe, as well as under the MA-200 on the daily chart, highlighting sustained downside pressure. Immediate resistance is set by the Ichimoku Kijun at $123.36. Momentum signals remain broadly negative: MACD, ADX, and Awesome Oscillator are showing downside indications, with RSI at 32.29 (Sell) and CCI in Oversold territory. Stochastic RSI is also Oversold, and Bull/Bear Power remains negative, confirming intraday dominance by sellers. Price is near the session’s low amid moderate volatility, with intraday moves aligning with the prevailing bearish indicators.
Range-bound outlook persists amid heightened downside risk
In the short term, DUK is expected to consolidate within a typical volatility band between $119.37 and $122.57 over the next few trading days. The probability of a rebound is low, estimated at 23%, while downside risk is elevated at 77%. The baseline view is for range-bound trading within this zone. Upside potential hinges on a breakout above the $123.36 resistance defined by the Ichimoku Kijun, which could trigger a recovery. If price falls below $119.37, an acceleration in selling pressure is likely.
Previously it was reported that Duke Energy's second-quarter 2026 financial results acted as a potential catalyst, yet technical barriers maintained a bearish outlook for the stock. Current technical conditions reaffirm ongoing downside pressure, with price weakness persisting until a clear breakout above immediate resistance alters the prevailing pattern.





Latest Duke Energy News



-
 Afghanistan
-
 Albania
-
 Algeria
-
 Angola
-
 Argentina
-
 Armenia
-
 Australia
-
 Austria
-
 Azerbaijan
-
 Bahamas
-
 Bahrain
-
 Bangladesh
-
 Belarus
-
 Belgium
-
 Bolivia
-
 Botswana
-
 Brazil
-
 Brunei
-
 Bulgaria
-
 Cambodia
-
 Cameroon
-
 Canada
-
 Chile
-
 China
-
 Colombia
-
 Congo
-
 Costa Rica
-
 Cote d'Ivoire
-
 Croatia
-
 Cuba
-
 Cyprus
-
 Czechia
-
 DR Congo
-
 Denmark
-
 Dominican Republic
-
 Ecuador
-
 Egypt
-
 El Salvador
-
 Estonia
-
 Eswatini
-
 Ethiopia
-
 Finland
-
 France
-
 Georgia
-
 Germany
-
 Ghana
-
 Greece
-
 Haiti
-
 Hong Kong
-
 Hungary
-
 India
-
 Indonesia
-
 Iran, Islamic republic
-
 Iraq
-
 Ireland
-
 Israel
-
 Italy
-
 Jamaica
-
 Japan
-
 Jordan
-
 Kazakhstan
-
 Kenya
-
 Korea
-
 Kuwait
-
 Kyrgyzstan
-
 Laos
-
 Latvia
-
 Lebanon
-
 Lesotho
-
 Libya
-
 Lithuania
-
 Luxembourg
-
 Madagascar
-
 Malaysia
-
 Malta
-
 Mauritius
-
 Mexico
-
 Moldova
-
 Mongolia
-
 Montenegro
-
 Morocco
-
 Mozambique
-
 Myanmar
-
 Namibia
-
 Nepal
-
 Netherlands
-
 New Zealand
-
 Nigeria
-
 North Macedonia
-
 Norway
-
 Oman
-
 Pakistan
-
 Palestine
-
 Panama
-
 Papua New Guinea
-
 Paraguay
-
 Peru
-
 Philippines
-
 Poland
-
 Portugal
-
 Puerto Rico
-
 Qatar
-
 Reunion
-
 Romania
-
 Rwanda
-
 Saudi Arabia
-
 Serbia
-
 Singapore
-
 Slovakia
-
 Slovenia
-
 Somalia
-
 South Africa
-
 Spain
-
 Sri Lanka
-
 Sweden
-
 Switzerland
-
 Syria
-
 Taiwan
-
 Tajikistan
-
 Tanzania
-
 Thailand
-
 Trinidad and Tobago
-
 Tunisia
-
 Turkey
-
 UAE
-
 Uganda
-
 Ukraine
-
 United Kingdom
-
United States
-
 Uruguay
-
 Uzbekistan
-
 Venezuela
-
 Vietnam
-
 Yemen
-
 Zambia
-
 Zimbabwe
- Forex
- Crypto












