

Why is AST SpaceMobile stock falling today? Wider net loss and $65.01 support in focus

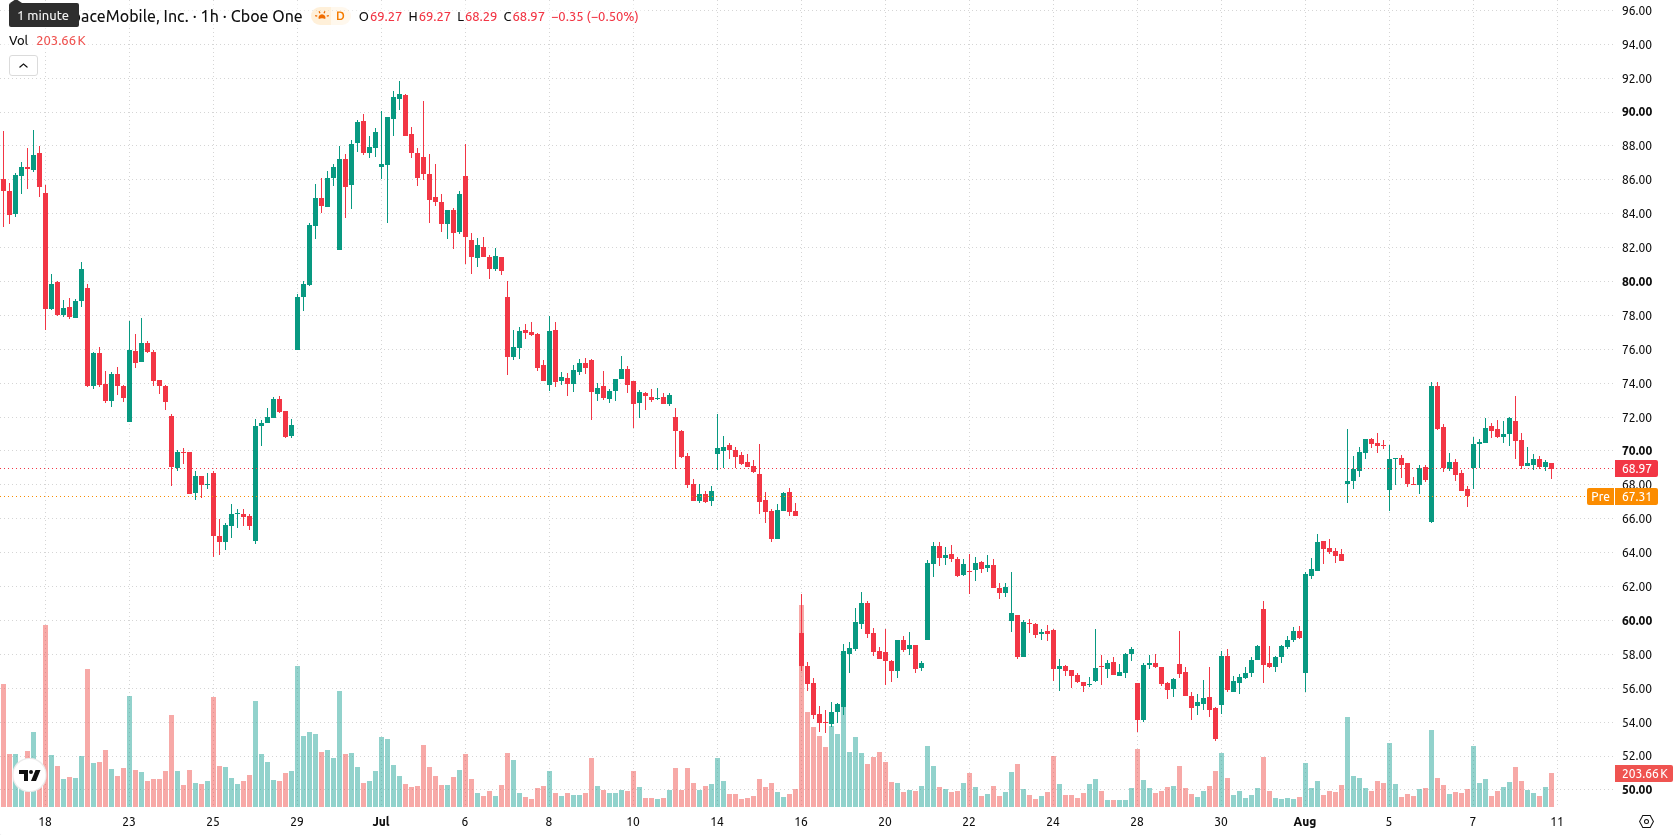
AST SpaceMobile (ASTS) stock is trading at $68.76 after falling 4.42% today. The stock sits below its key short-term moving averages but holds above some medium-term levels.
 29.16
36.33
Highlights
- AST SpaceMobile reported second-quarter 2026 revenue of $31.5 million and a net loss of $230.9 million, wider than expected.
- The company reaffirmed its 2026 revenue guidance at $150 million to $200 million and secured a $1.3 billion revenue backlog with over $100 million in new U.S. government awards.
- Shares of AST SpaceMobile trade with short-term selling pressure and high volatility, with expected range of $65.01 to $72.51 over the next sessions.
Revenue miss and constellation growth as guidance steadies sentiment
AST SpaceMobile reported second-quarter 2026 revenue of $31.5 million and a net loss of $230.9 million, or $0.77 per share, for the period ended June 30, 2026, with Finance Yahoo highlighting that the loss was wider than expected. The company reaffirmed its full-year 2026 revenue guidance in the range of $150 million to $200 million, as reported by Benzinga, which may provide some reassurance to investors but does not immediately offset the quarterly disappointment. In August 2026, AST SpaceMobile expanded its satellite constellation to 13 spacecraft with the addition of BlueBird 11, 12, and 13, and the revenue backlog climbed to about $1.3 billion, supported by commercial deals and multiple new U.S. government awards exceeding $100 million in value, according to Finance Yahoo.
Mixed momentum as price tests below short- and above mid-term averages
On the technical front, ASTS is trading below its MA-20 but maintains a position above its MA-50 on the hourly chart, while staying under the long-term MA-200. The Ichimoku Kijun level at $69.88 serves as immediate resistance. Momentum indicators present a mixed picture: MACD shows a strong buy and ADX a buy, whereas RSI and CCI point to sell conditions and the Stoch RSI is in oversold territory. Bull/Bear Power is also oversold, reflecting active intraday selling. The Awesome Oscillator remains neutral, showing no clear direction. These conflicting signals highlight ongoing volatility and diverging short-term signals.
Upward bias faces consolidation risk amid defined trading band
Looking ahead to the next few sessions, the expected trading range for ASTS is $65.01 to $72.51, with a 59% probability for an upward move versus 41% probability for further downside. If the price remains within this band, further consolidation is likely as a baseline scenario. A breakout above $69.88 resistance could see a test of the upper range, while a breach of support would open the way for a move toward $65.01.
Previously it was reported that AST SpaceMobile faced persistent technical pressure and increased downside risk amid continued constellation growth and expanding partnerships. The latest results add a new dimension with mixed technical signals and a wider-than-expected loss, placing focus on the $69.88 resistance as a key level for potential upside breakout or further consolidation.






Latest AST SpaceMobile News



-
 Afghanistan
-
 Albania
-
 Algeria
-
 Angola
-
 Argentina
-
 Armenia
-
 Australia
-
 Austria
-
 Azerbaijan
-
 Bahamas
-
 Bahrain
-
 Bangladesh
-
 Belarus
-
 Belgium
-
 Bolivia
-
 Botswana
-
 Brazil
-
 Brunei
-
 Bulgaria
-
 Cambodia
-
 Cameroon
-
 Canada
-
 Chile
-
 China
-
 Colombia
-
 Congo
-
 Costa Rica
-
 Cote d'Ivoire
-
 Croatia
-
 Cuba
-
 Cyprus
-
 Czechia
-
 DR Congo
-
 Denmark
-
 Dominican Republic
-
 Ecuador
-
 Egypt
-
 El Salvador
-
 Estonia
-
 Eswatini
-
 Ethiopia
-
 Finland
-
 France
-
 Georgia
-
 Germany
-
 Ghana
-
 Greece
-
 Haiti
-
 Hong Kong
-
 Hungary
-
 India
-
 Indonesia
-
 Iran, Islamic republic
-
 Iraq
-
 Ireland
-
 Israel
-
 Italy
-
 Jamaica
-
 Japan
-
 Jordan
-
 Kazakhstan
-
 Kenya
-
 Korea
-
 Kuwait
-
 Kyrgyzstan
-
 Laos
-
 Latvia
-
 Lebanon
-
 Lesotho
-
 Libya
-
 Lithuania
-
 Luxembourg
-
 Madagascar
-
 Malaysia
-
 Malta
-
 Mauritius
-
 Mexico
-
 Moldova
-
 Mongolia
-
 Montenegro
-
 Morocco
-
 Mozambique
-
 Myanmar
-
 Namibia
-
 Nepal
-
 Netherlands
-
 New Zealand
-
 Nigeria
-
 North Macedonia
-
 Norway
-
 Oman
-
 Pakistan
-
 Palestine
-
 Panama
-
 Papua New Guinea
-
 Paraguay
-
 Peru
-
 Philippines
-
 Poland
-
 Portugal
-
 Puerto Rico
-
 Qatar
-
 Reunion
-
 Romania
-
 Rwanda
-
 Saudi Arabia
-
 Serbia
-
 Singapore
-
 Slovakia
-
 Slovenia
-
 Somalia
-
 South Africa
-
 Spain
-
 Sri Lanka
-
 Sweden
-
 Switzerland
-
 Syria
-
 Taiwan
-
 Tajikistan
-
 Tanzania
-
 Thailand
-
 Trinidad and Tobago
-
 Tunisia
-
 Turkey
-
 UAE
-
 Uganda
-
 Ukraine
-
 United Kingdom
-
United States
-
 Uruguay
-
 Uzbekistan
-
 Venezuela
-
 Vietnam
-
 Yemen
-
 Zambia
-
 Zimbabwe
- Forex
- Crypto












